 Spectrum Analyzer

Learn more about the Moku Spectrum Analyzer
The Moku Spectrum Analyzer is part of the reconfigurable Moku test platform, ideal for generating, routing, and verifying signals in complex experimental setups
Key benefits of the Moku Spectrum Analyzer

Track key spectral features
Use the built-in markers to measure onto features of interest. Probe up to eight peaks and view real-time and historical trends for peak level, frequency, power, and more.
Try the software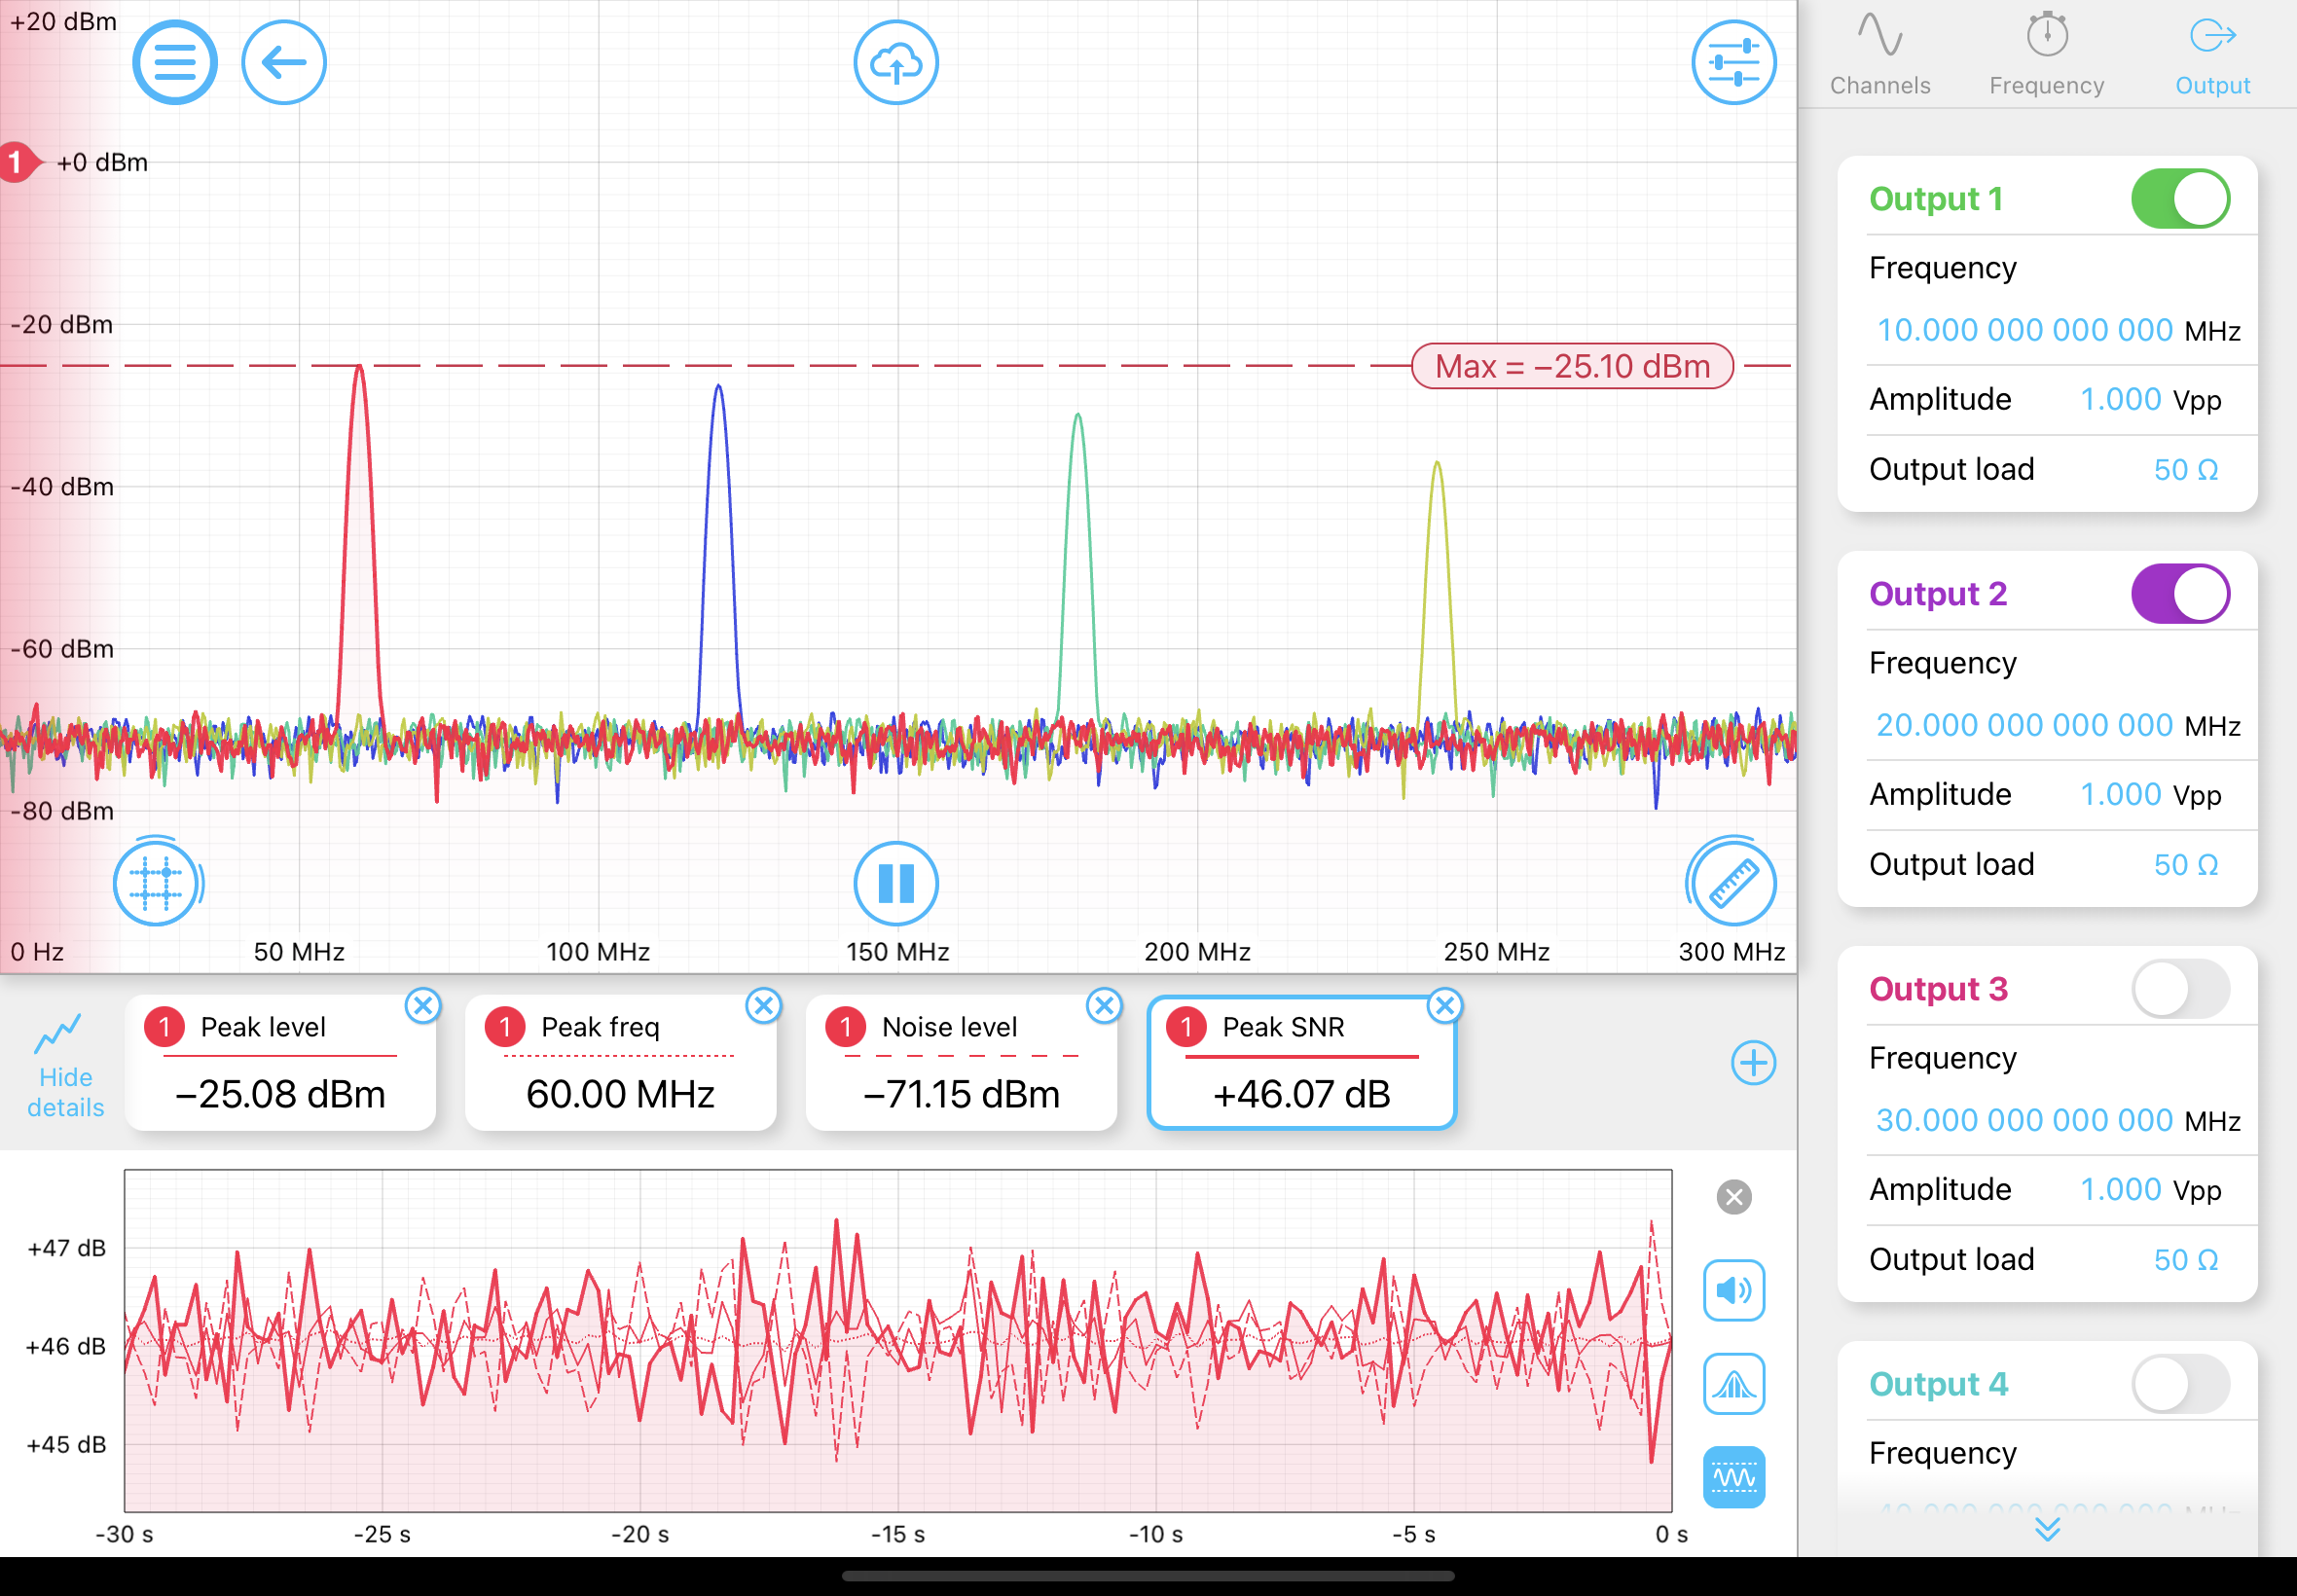
Output sine waves with the onboard Waveform Generators
Generate sine waves to stimulate your device under test, while viewing the frequency response in real time.
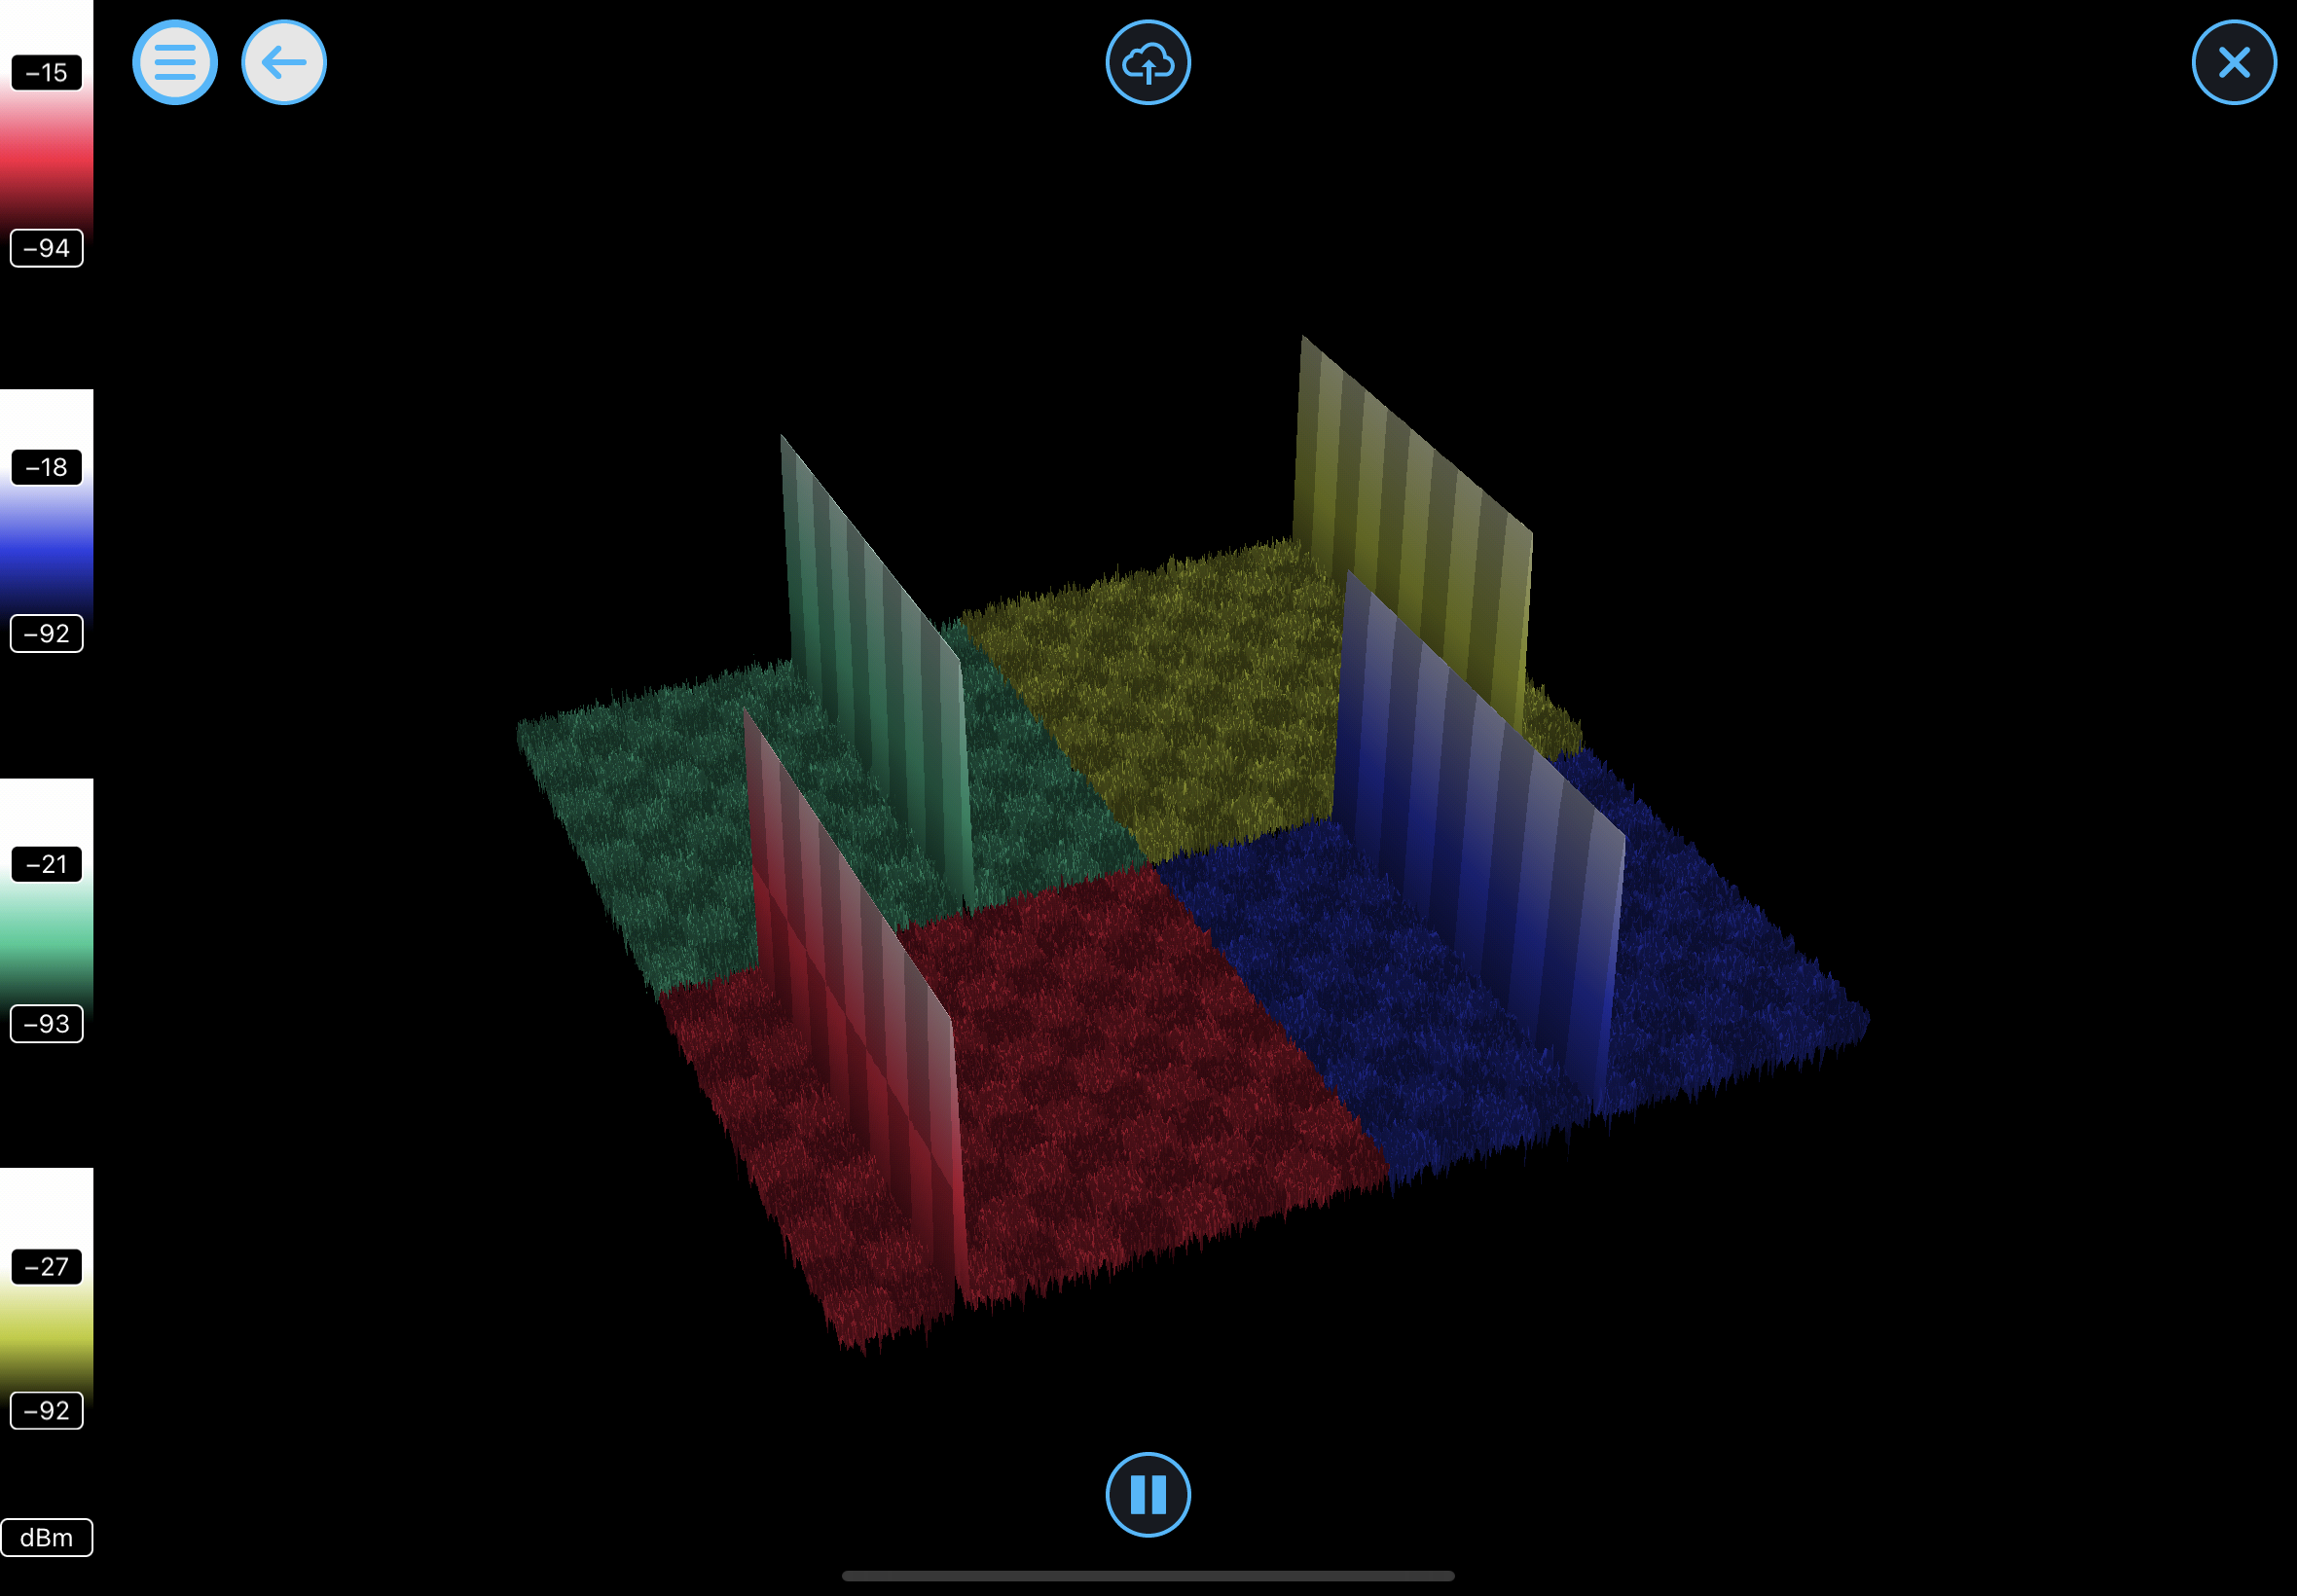
Visualize signals with the 3D waterfall plot
Use the 3D waterfall view feature to monitor spectrum changes over time and analyze your data from multiple angles.
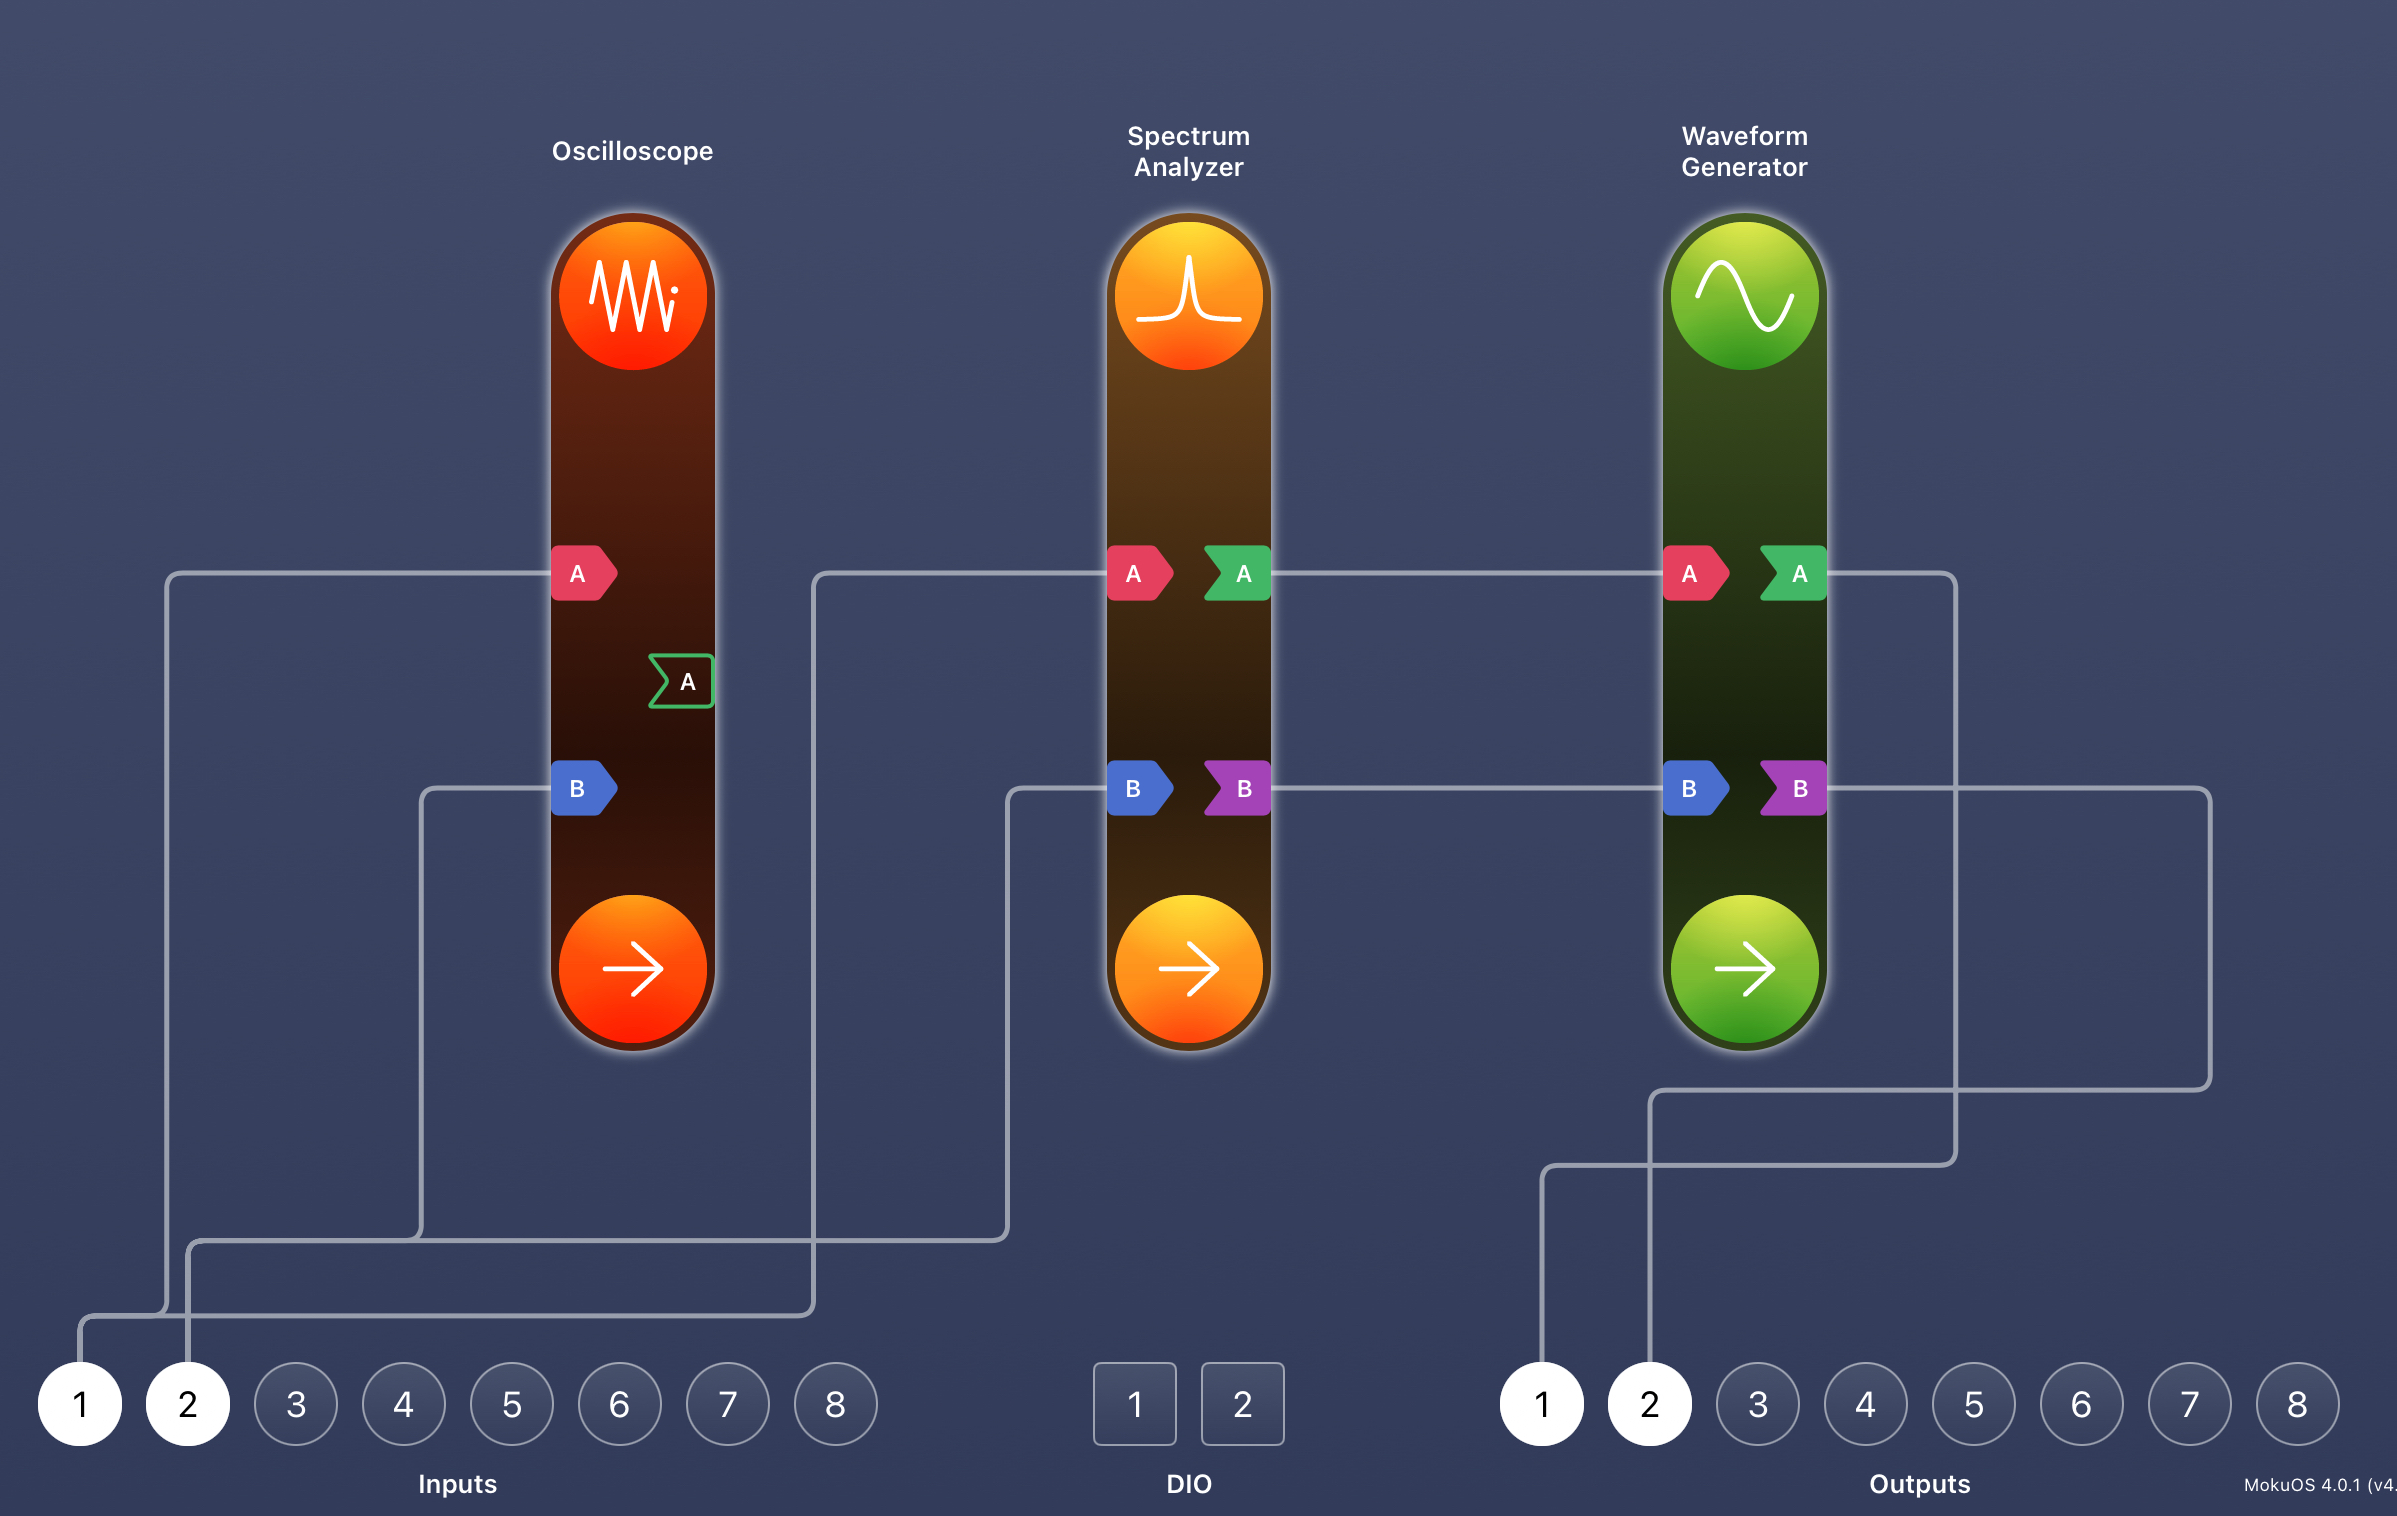
Operate in parallel with Multi-Instrument Mode
Pair it with the Moku Oscilloscope in Multi-Instrument Mode for time- and frequency-domain analysis. Connect to the analog front end, or losslessly route signals between instruments.

Integrate with your preferred APIs
Automate with Python, MATLAB, and LabVIEW APIs for straightforward control of complex setups or repetitive tasks.
Engineered for demanding applications
Use the Moku Spectrum Analyzer to accelerate development timelines with speed and flexibility unmatched by any other instrument in its class.

Frequency domain analysis

Noise measurements

RF system design

Spurious signal identification

System response characterization
Integrates seamlessly with your tech stack
Specifications
The Moku Spectrum Analyzer runs on Moku:Delta, Moku:Pro, Moku:Lab, and Moku:Go. Compare the specifications to choose the right device for your application.

Moku:Delta |

Moku:Pro |

Moku:Lab
|

Moku:Go | |||||||||||||||||||||
|---|---|---|---|---|---|---|---|---|---|---|---|---|---|---|---|---|---|---|---|---|---|---|---|---|
| Learn more | Learn more | Learn more | Learn more | |||||||||||||||||||||
Moku:Delta |
Moku:Pro |
Moku:Lab
|
Moku:Go | |||||||||||||||||||||
| Learn more | Learn more | Learn more | Learn more | |||||||||||||||||||||
| Technical specifications | ||||||||||||||||||||||||
| Channels | 8 | 4 | 2 | 2 | ||||||||||||||||||||
| Frequency range | DC to 2 GHz | DC to 600 MHz | DC to 250 MHz | DC to 30 MHz | ||||||||||||||||||||
| Minimum RBW | 618.5 mHz | 2.2 Hz | 1 Hz | 470 mHz | ||||||||||||||||||||
| Input noise | < 10 nV/√Hz | 30 nV/√Hz | N/A | N/A | ||||||||||||||||||||
")


