


Updated April 24, 2023
In this application note, we produce the frequency response of a typical EMI/RFI filter and compare it to the manufacturer’s specified datasheet.
The Moku:Lab Frequency Response Analyzer is one of fifteen instruments, enabling measurements of a system’s response in amplitude and phase, using a swept sine wave from 10mHz to 120MHz. This procedure is also supported by the Moku:Go and Moku:Pro Frequency Response Analyzer instruments.

Frequency Response Analyzer
The Moku:Lab Frequency Response Analyzer (FRA) drives a swept sine wave on the outputs and simultaneously measures the received signal amplitude (or power) and phase on the inputs. This can be used to measure the transfer function of a system or device under test, from 10mHz to 120MHz and thus create a plot of amplitude and phase vs frequency, sometimes referred to as a Bode plot. In this application we drive the swept sine wave into a Radio Frequency Interference (RFI) filter and observe the common mode rejection ratio. This is then compared to the manufacturer’s typical performance chart
EMI filter background
All electronic devices emit electromagnetic interference (EMI) (or radio frequency interference (RFI)) and are susceptible to conducted emissions from other devices. In particular, any electronic device connecting to a mains power supply needs to ensure it meets the relevant international standards for EMI/RFI.
Commonly applicable standards are FCC part 15 (esp. part B, unintentional radiators) and part 18 (industrial, scientific & medical equipment, radiated and conducted emissions) and European standards EN55011, EN5502 &. EN55014.
These needs are commonly met with a power inlet filter or power entry module which filters the relevant RF energy.
Device under test; measurement setup
For the purposes of this application of the Moku:Lab Frequency Response Analyzer, we selected an EMI filter component from Corcom; a leading supplier of such modules. (Corcom website)
The device selected is a Corcom 10VB3 (datasheet). The electrical schematic is shown in figure 1.
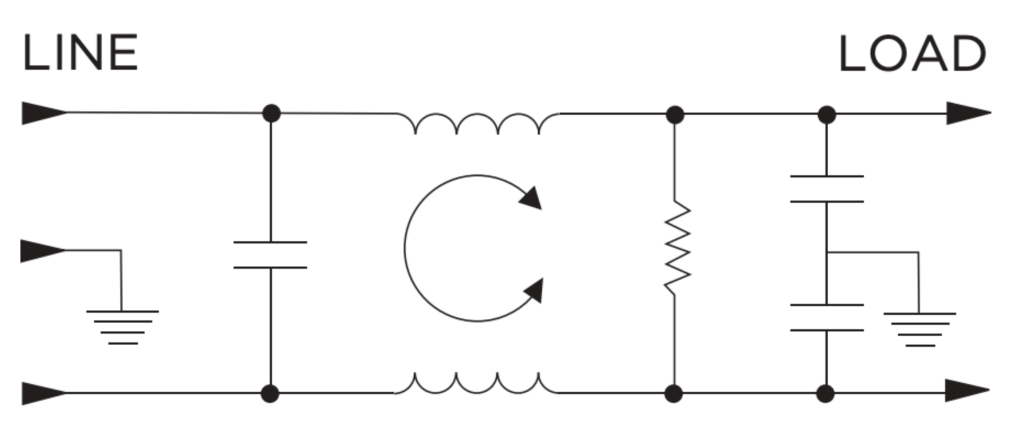 Figure 1: Corcom filter schematic
Common mode insertion loss
The common mode insertion loss of an EMI filter is a parameter that is typically measured and specified by a manufacturer. While this is not necessarily a measure of the filter’s performance in a particular device, it is used for test and validation. This is measured with the test setup shown in figure 2.
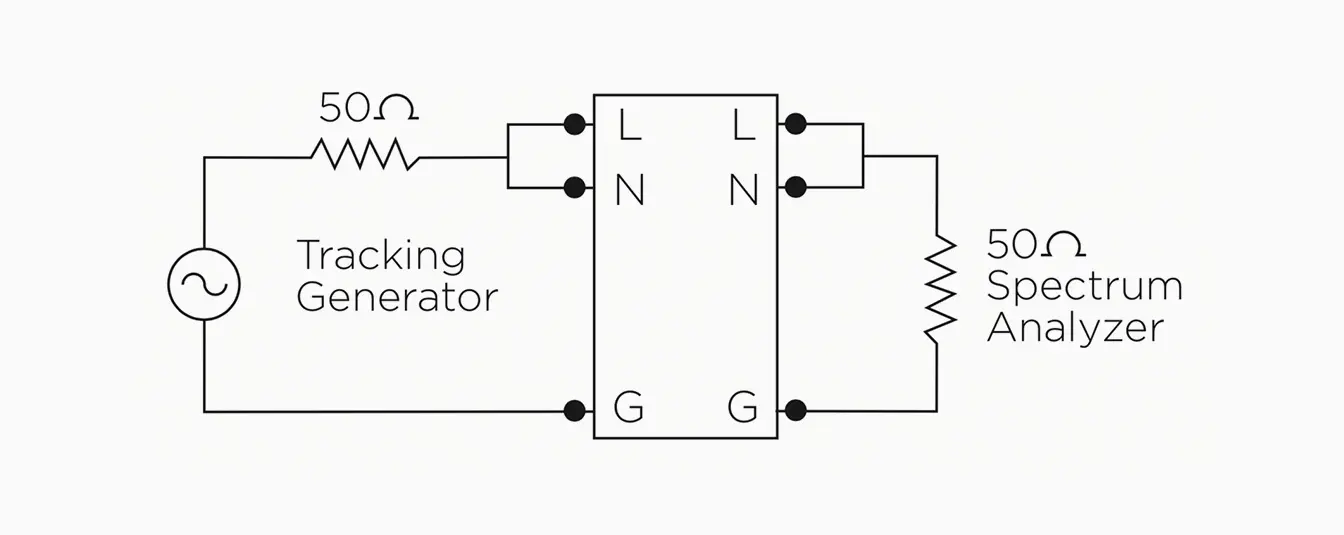
Figure 2: Common mode insertion loss setup
This effectively places the ‘line’ and ‘neutral’ inductor components in parallel and facilities a straightforward measurement of their frequency response. Note also that it is necessary that the source and load impedance (of the test equipment) be of low impedance, e.g. 50Ω
Moku:Lab setup
The Moku:Lab Frequency Response Analyzer is well suited to this EMI filter common mode insertion loss measurement and provides the functionality of the tracking generator (swept sine wave) and spectrum analyzer (amplitude and phase response) at the DUT output.
 |
 |
||
|
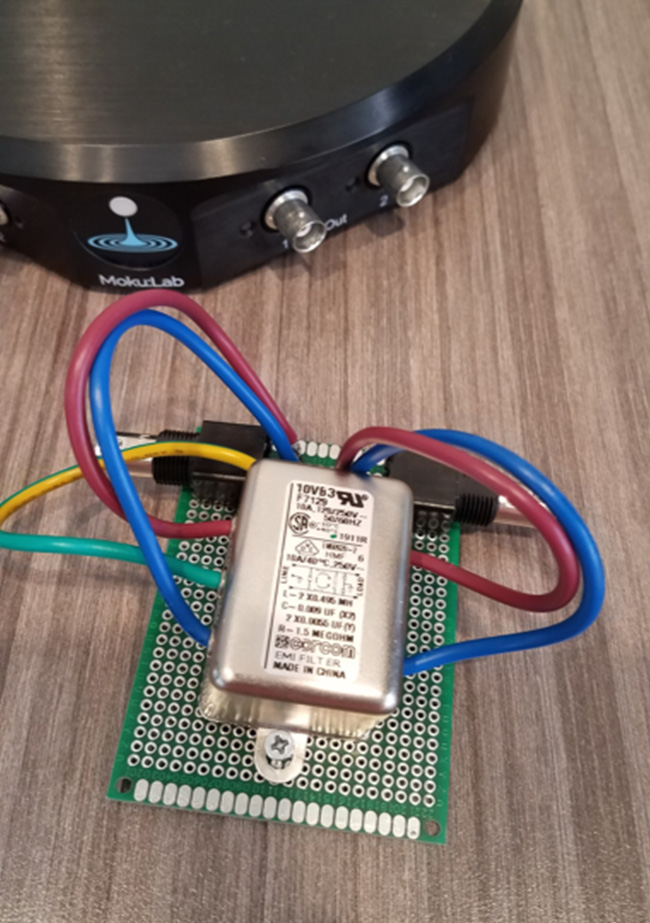
Figure 3: EMI filter ready to test |
Figure 4: Test Setup |
The test setup is straightforward and requires no test equipment other than Moku:Lab; figure 3 & figure 4.
Moku:Lab provides input and output impedances that can be set to 1 MΩ or 50Ω. So for this test, both are set to 50Ω. The output channel tab on the tablet interface is used to configure the frequency sweep from 100kHz to 31 MHz to cover the range of interest.
Results
Moku:Lab produced the plot shown in figure 5. The user interface allows for the cursors to be quickly added to measure specific amplitude and phase at selected frequencies.
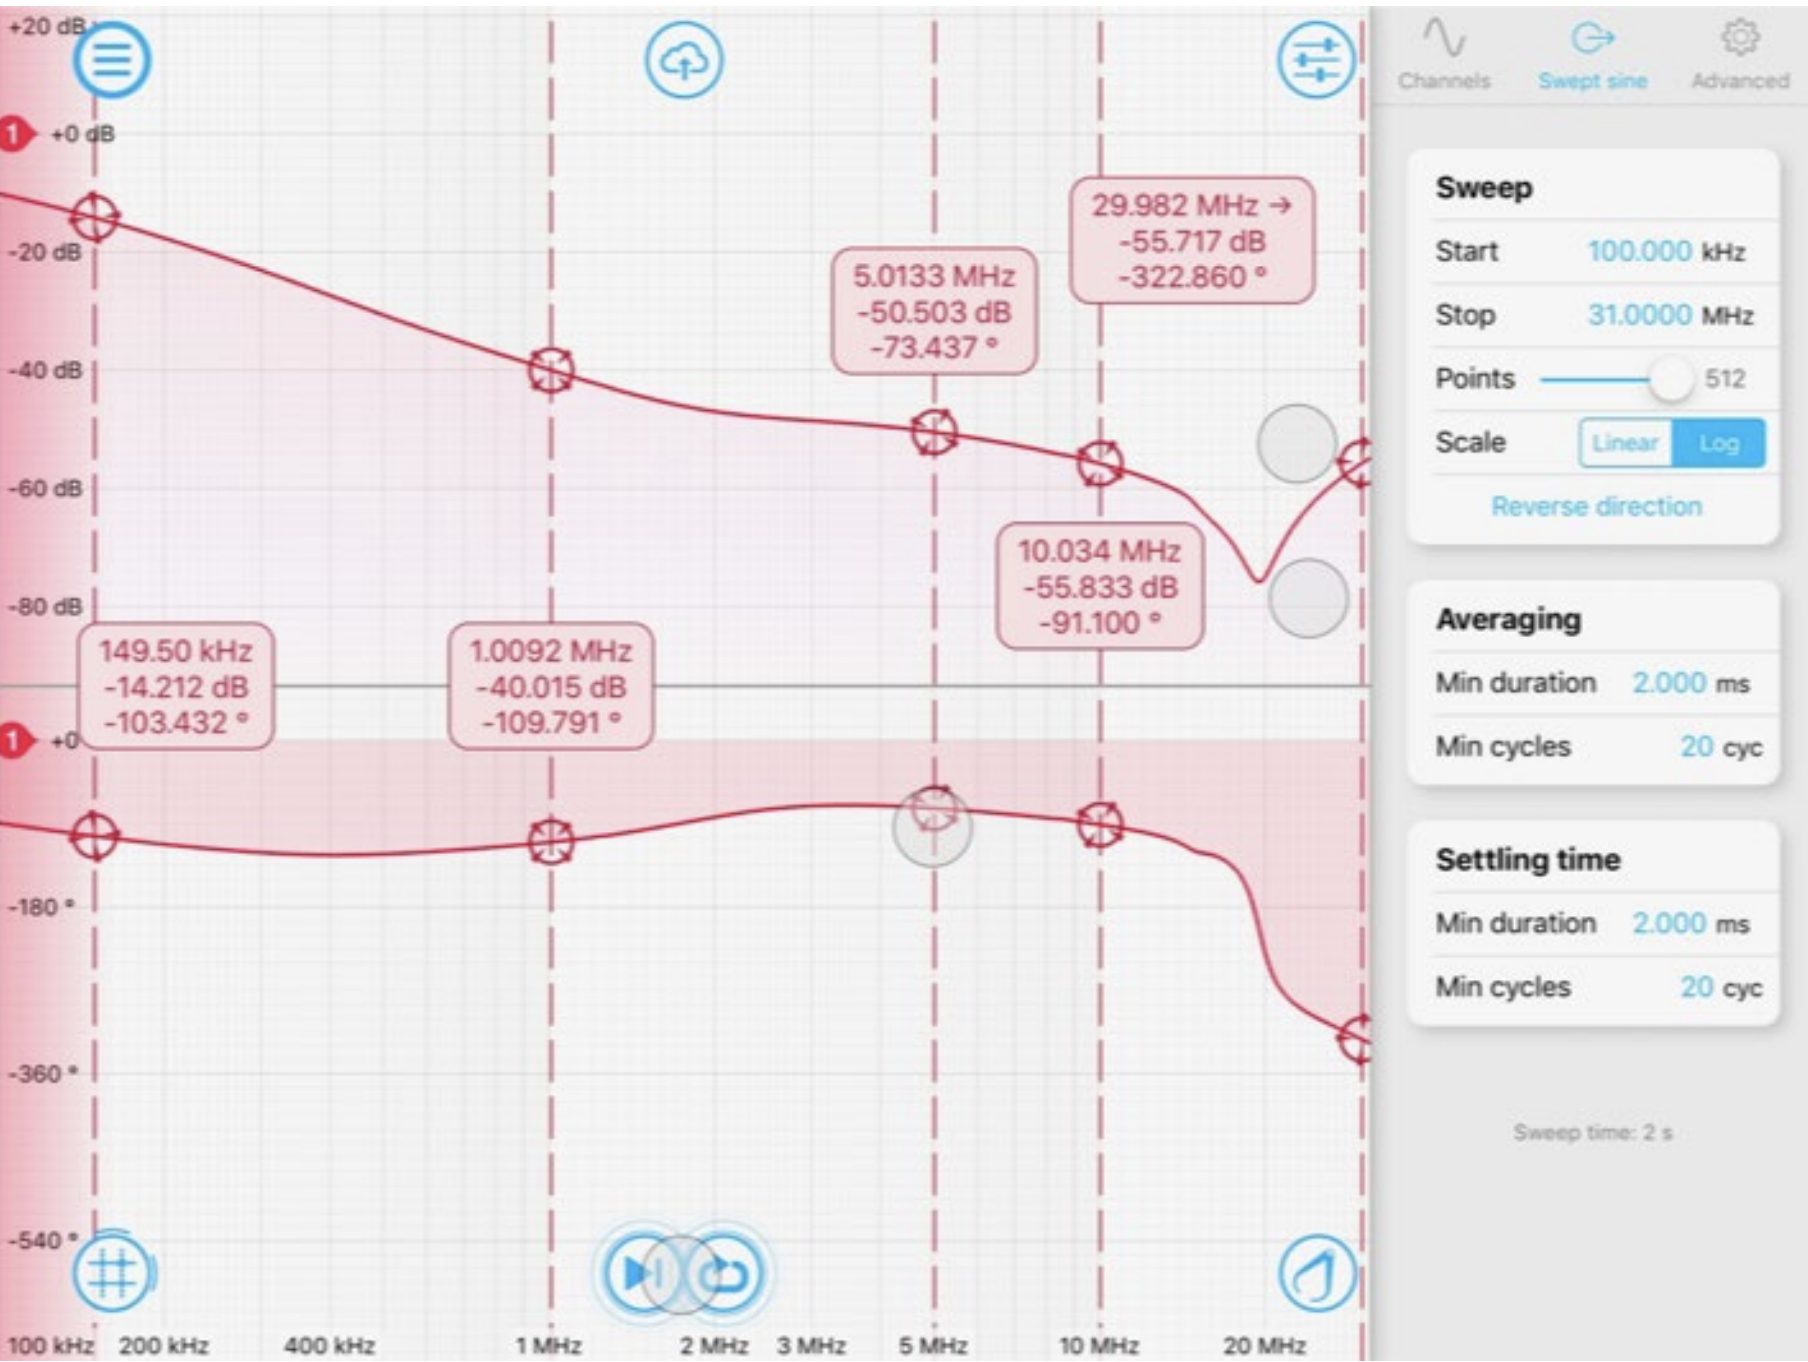
Figure 5: Moku:Lab EMI filter plot & measurements
The manufacturer’s data provides minimum specifications for common mode insertion loss together with a ‘typical’ performance curve. These minimums are in table 1 together with the loss ratio measured by Moku:Lab.

Table 1: Moku:Lab measurements & manufacturers minimums, vs frequency
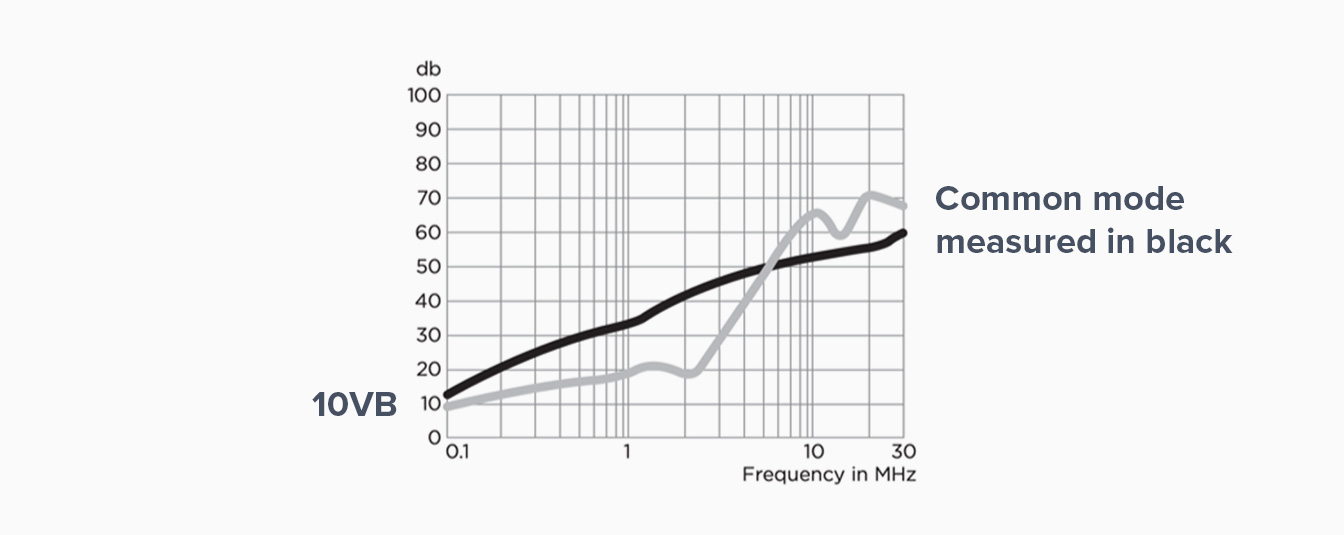
Figure 6: Typical performance
Table 1 shows that our specific DUT filter exceeds the manufacturers specification across the frequency range. The minimum specifications are very conservative.
In order to compare the manufacturer’s typical performance curve (figure 6) with Moku:Lab results, the Moku:Lab chart was exported to iCloud (simply by tapping the cloud icon) and then annotated with amplitude/loss points read from figure 6.
The result is figure 7 and this shows a very close correspondence of the Moku:Lab measured common mode loss and the manufacturer’s typical performance for this EMI filter.
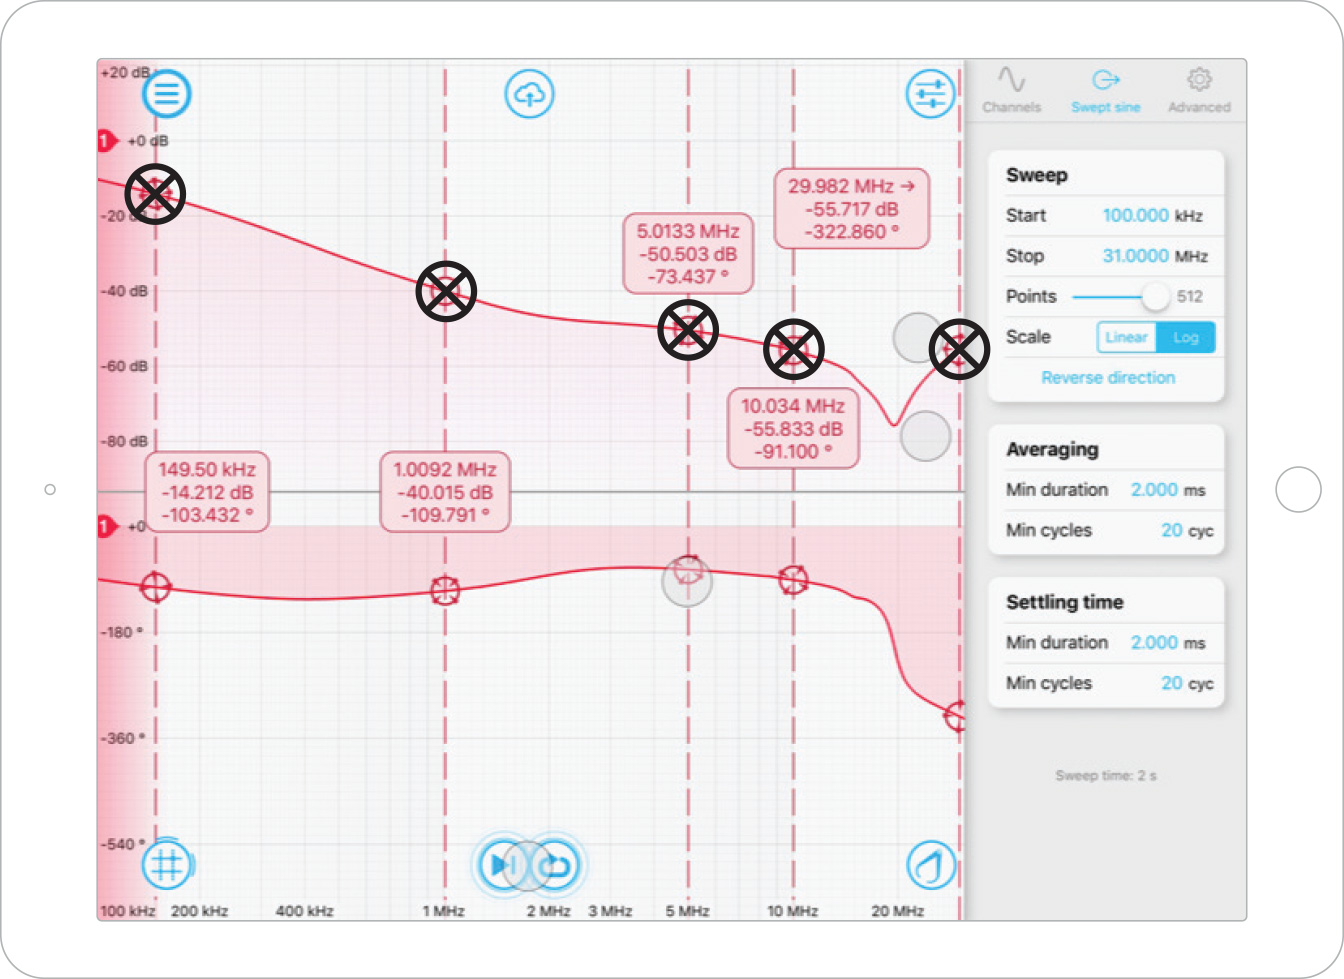
Figure 7: Moku:Lab measurements annotated with manufacturers typical performance
Circles with crosses indicate points from Corcom ‘typical’ chart
Conclusion
This application note has demonstrated the application of the Moku:Lab Frequency Response Analyzer to the measurement of the common mode insertion loss ratio of a typical EMI filter.
The results were obtained quickly and efficiently with the touch-based user interface and the resulting plots shared directly as graphic files via iCloud and Dropbox for inclusion in this application note.
The filter performed beyond the manufacturer’s minimum specification; the results compared very closely with the claimed typical performance curve.
Reference
[1] Corcom 10VB3 datasheet
https://www.te.com/commerce/DocumentDelivery/DDEController?Action=srchrtrv&DocNm=1654001_CORCOM_PRODUCT_GUIDE_B_SERIES&DocType=CS&DocLang=English%20
[2] Corcom product catalog; page 268 test method
https://www.te.com/commerce/DocumentDelivery/DDEController?Action=showdoc&DocId=Catalog+Section%7F1654001_CORCOM_PRODUCT_GUIDE%7F0611%7Fpdf%7FEnglish%7FENG_CS_1654001_CORCOM_PRODUCT_GUIDE_0611.pdf%7FCAT-C8114-N1%20