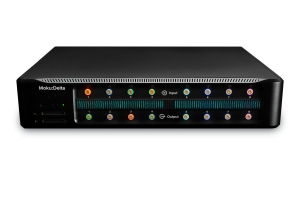
Moku:Go combines 15+ lab instruments in one high-performance device. This application note discusses a typical undergraduate electronics lab exercise and how it can be effectively conducted using Moku:Go and its Windows or macOS app. Moku:Go’s programmable power supplies power the integrated circuit and the analog inputs and outputs can stimulate and characterize the circuit behavior.

Moku:Go
 This lab will make use of Moku:Go’s Oscilloscope, Waveform Generator, Frequency Response Analyzer and Programmable Power Supplies (Models M1 or M2 required). We will build a Butterworth filter using a commonly available operational amplifier (op-amp) and use Moku:Go to analyze and learn about its function like a lab exercise.
Passive & active filters lab
 Figure 1: Typical bench setup for filter lab
A traditional approach to filter laboratories in Electronic and Computer Engineering labs is to introduce simple passive, resistor, capacitor, and inductor (RCL) networks and to explore their frequency response with a function generator, oscilloscope, and perhaps a digital multimeter. Once the passive RLC has been explored the tutorials typically move onto active, op-amp-based filters with their sharper cut-offs & more complex transfer functions. One or two external lab power supplies will now be needed in addition.
Butterworth filter
Figure 2 is a schematic of an op-amp-based, low-pass 2nd-order Butterworth filter.
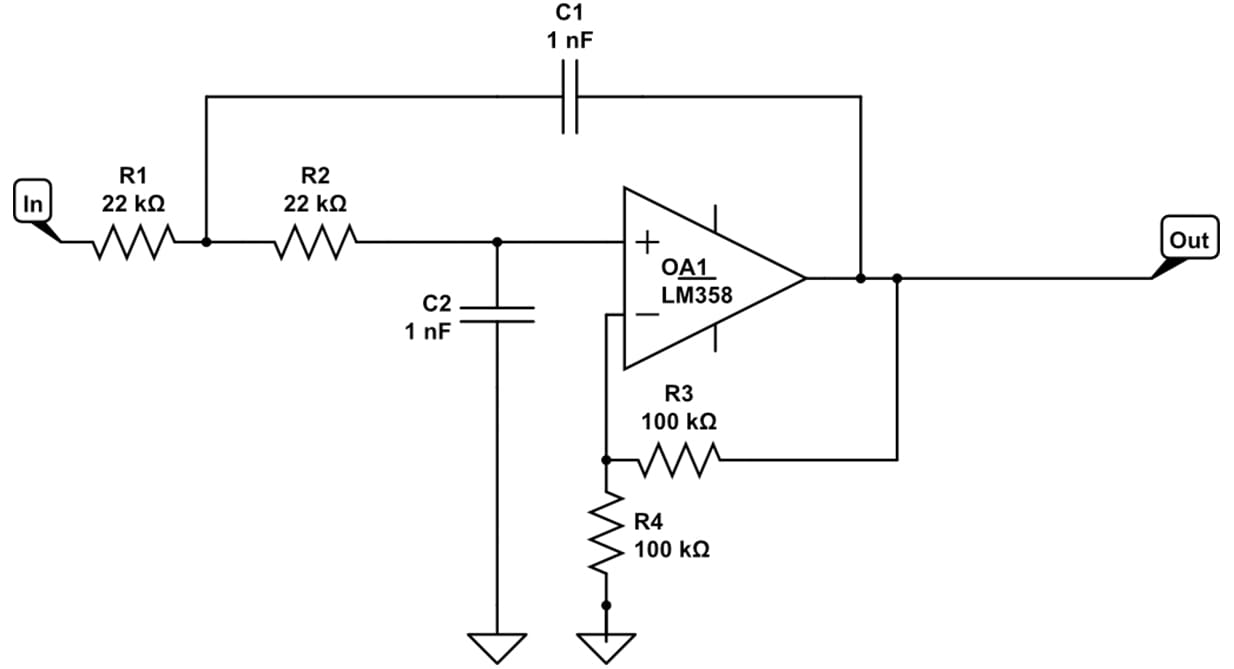 Figure 2: 2nd order Butterworth filter schematic
We constructed this filter on a prototyping breadboard much in the way students would be directed in a tutorial. This uses a commonly available dual op-amp, the LM358 from Texas Instruments, which has dual power supplies. We will set them at +5 V and -5 V to enable full output swing. These are powered from Moku:Go’s power supply #1 and #2 (banana style jacks on the rear panel) and configured via the software.
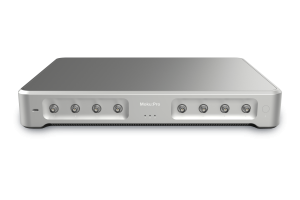
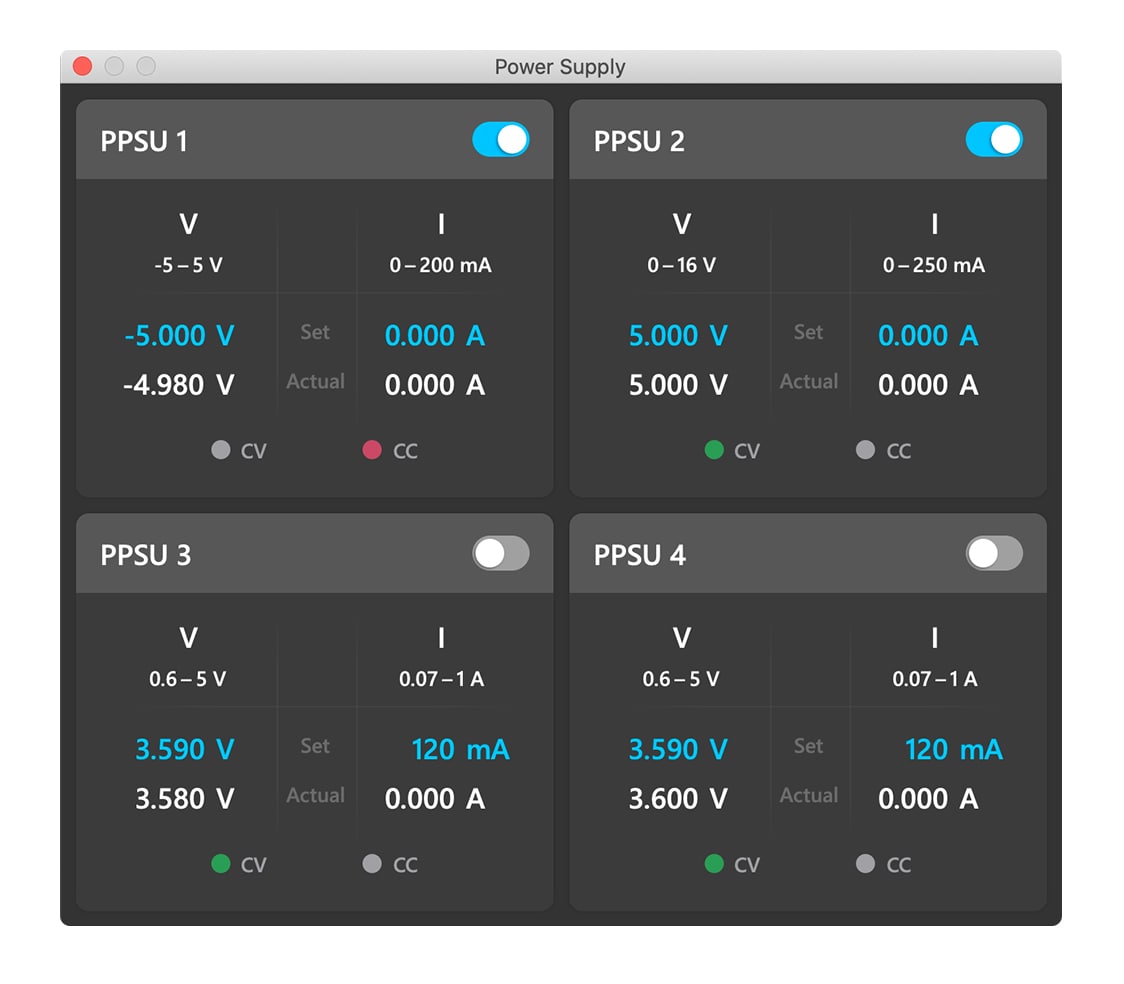 Figure 3: Moku:Go integrated power supplies
Referring to theory lectures and materials ahead of the lab, students will recall that the cut-off frequency (or bandwidth) is given by:
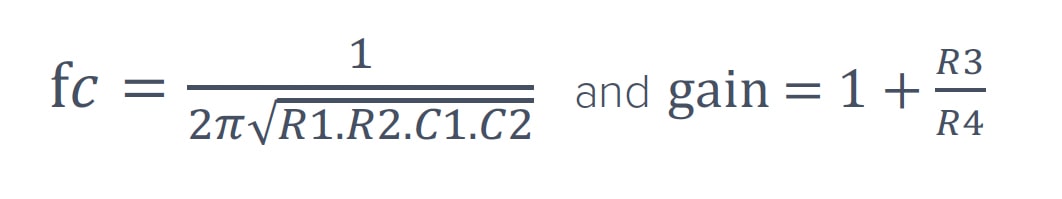 In this example we have chosen R1 and R2 to be 22kΩ, R3 and R4 to be 100kΩ, C1 and C2 = 1nF, thus giving fc = 7.2 kHz and gain of 2 (or 6 dB).
A common approach is to now direct students to use a function generator to apply a sine wave across a selection of frequencies. The output and input are then measured manually on an oscilloscope and subsequently transferred to a plot of amplitude and phase. This plot is a Bode plot of the filter frequency response. Moku:Go’s Oscilloscope has a built-in waveform generator so this hands-on, manual frequency response can be plotted with no additional lab equipment. Figure 4 shows the Oscilloscope and its integrated waveform generator being used to investigate and take measurements of the amplitude and phase of the input and outputs. Channel 2 (blue) is measuring the waveform generator signal applied to the filter input, while Channel 1 (red) shows the output of the filter.
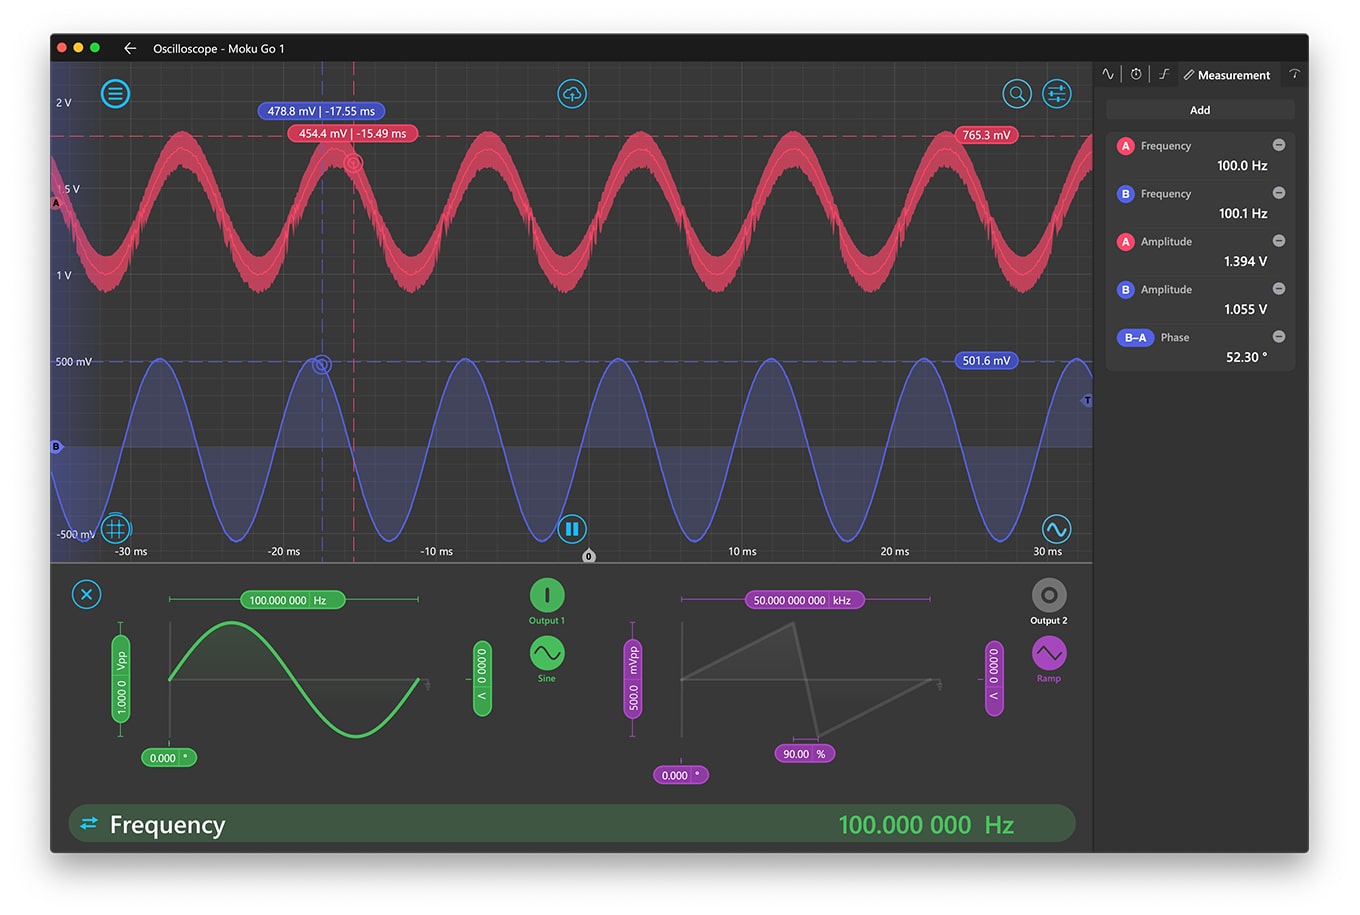 Figure 4: Moku:Go’s Oscilloscope with integrated waveform generator
Using Moku:Go’s Oscilloscope measurements, students can rapidly measure the amplitude and phase from DC through 20 MHz, in this case, to 20 kHz. Around 10 measurement pairs would be a minimum to plot the frequency response and so we could expect this task to take 30 or so minutes in the lab.
Moku:Go Frequency Response Analyzer
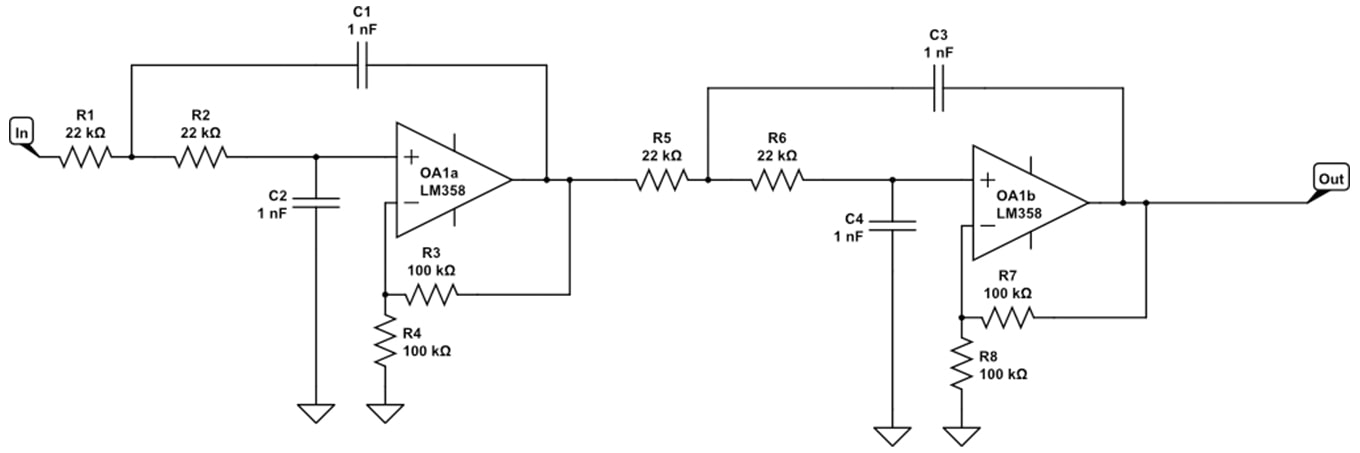 Figure 5: 4th order Butterworth filter
We created this again on a prototyping breadboard.
 Figure 6: Prototype Butterworth filter
Now is an excellent time to introduce students to the Frequency Response Analyzer. Rather than manually recording the magnitude and phase measurements, the process is automated. Moku:Go switches from the Oscilloscope to the Frequency Response Analyzer in a few seconds, and with a few moments of setup we have the response of the 4th order filter. Cursors can be used to measure the response and confirm the amplitude and phase match the expected transfer function.
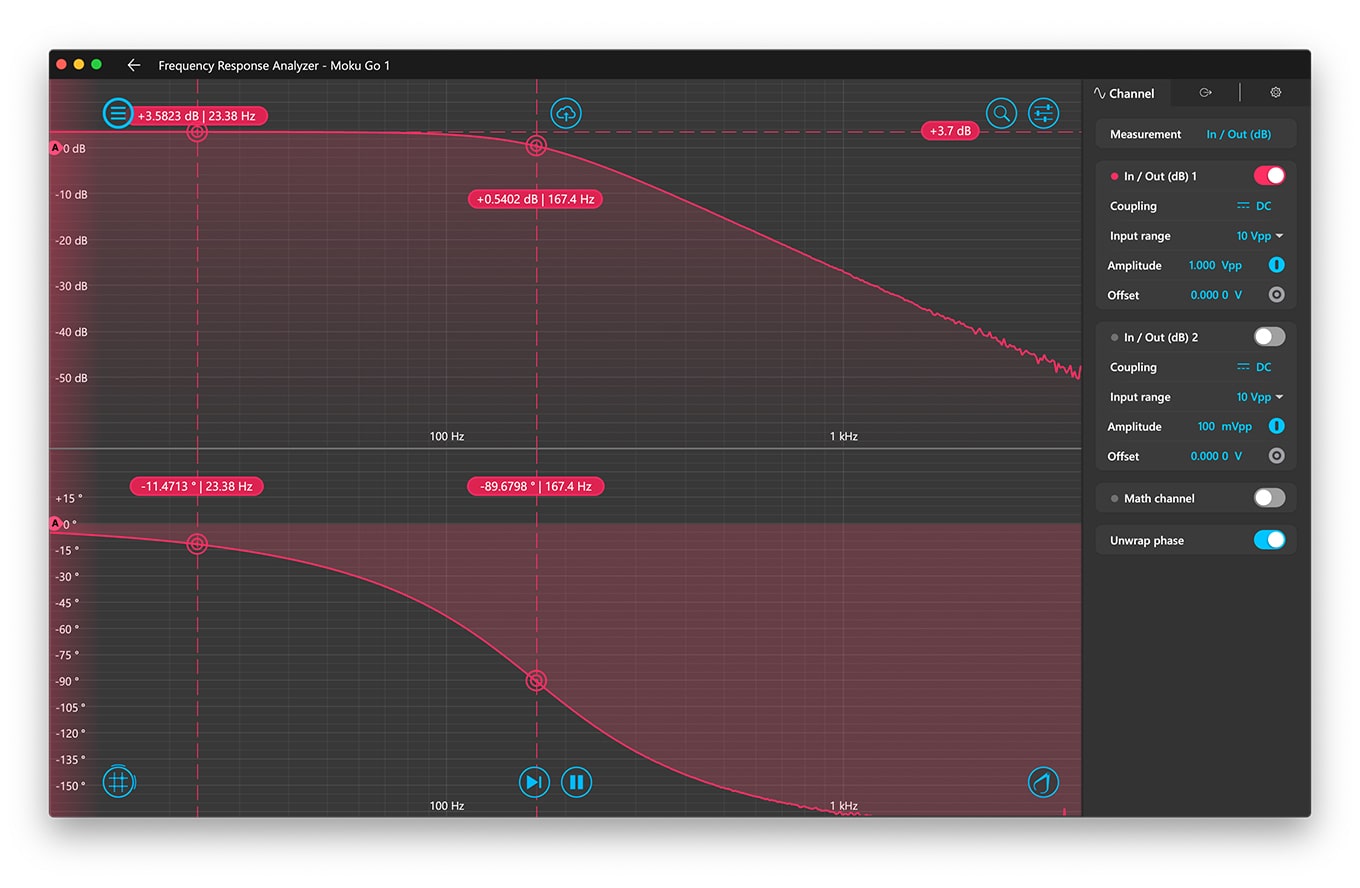 Figure 7: Butterworth filter response in Moku:Go’s Frequency Response Analyzer
Referring to theory lectures and materials ahead of the lab, students will recall that the cut-off frequency (or bandwidth) is given by:
Lab evaluations
Moku:Go software runs on Windows and macOS and it incorporates data logging and screenshot functionality. This makes it ideal for students to capture plots with cursors and submit them in personal reports for evaluation and grading.
Moku:Go complete lab setup
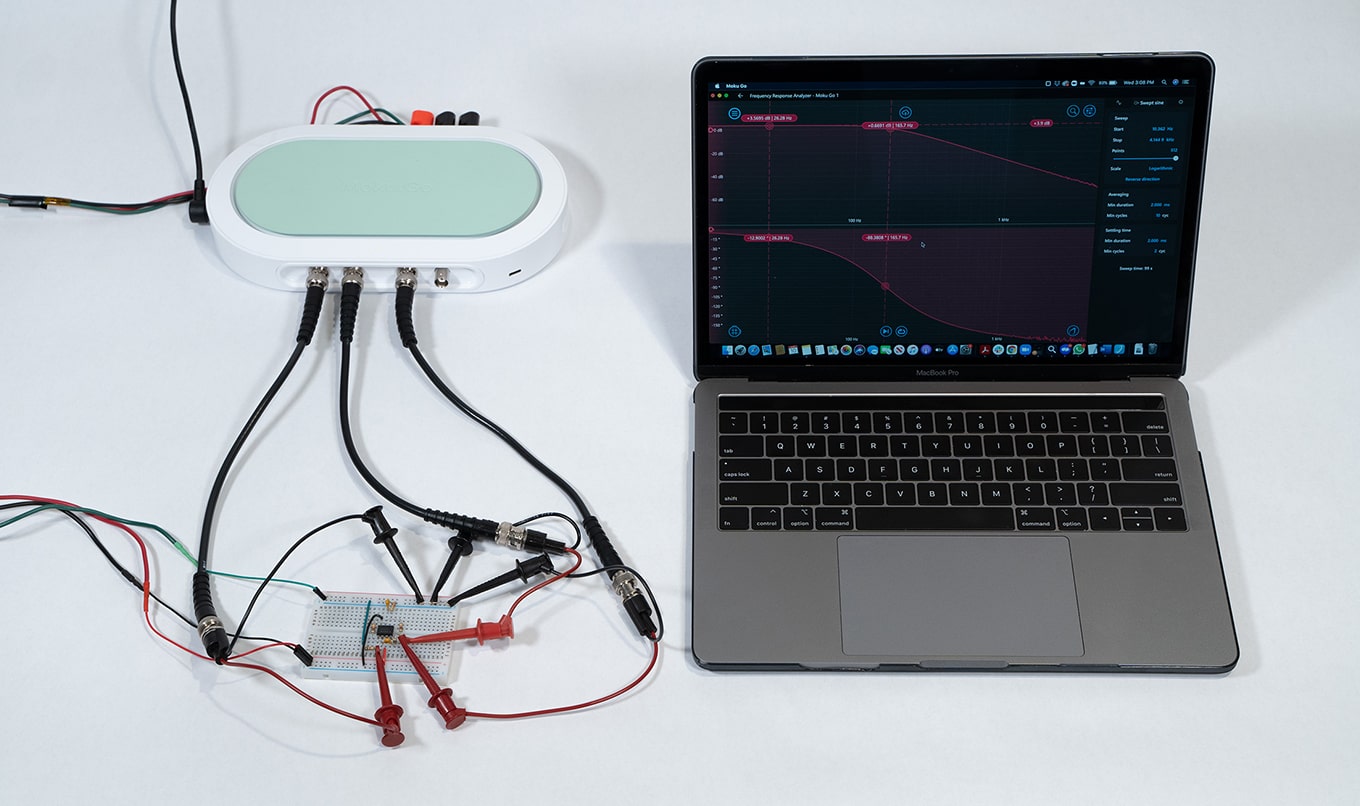 Figure 8: Complete setup for filter lab for Moku:Go
Moku:Go incorporates an intuitive UI with powerful instruments and available power supplies. The engineering lab is portable and enables off-site labs at the students’ time and place of convenience.
Benefits of Moku:Go
For the educator & lab assistants
- Efficient use of lab space and time
- Ease of consistent instrument configuration
- Focus on the electronics, not the instrument setup
- Maximize lab teaching assistant time
- Individual labs, individual learning
- Simplified evaluation and grading via screenshots
For the student
- Individual labs at their own pace enhance the understanding and retention
- Portable, choose pace, place and time for lab work be it home, on campus lab or even collaborate remotely
- Familiar Windows or macOS laptop environment, yet with professional-grade instruments
Moku:Go demo mode
You can download the Moku:Go app for macOS and Windows. The demo mode operates without the need for any hardware and provides a great overview of using Moku:Go
Have questions or want a printable version?
Please contact us at support@liquidinstruments.com