Transmission and reflection signal information is vital when designing and validating RF components and systems. In this application note, Moku:Lab’s Frequency Response Analyzer is used in conjunction with an RF directional coupler for a complete S-parameter characterization of a two port network.
Introduction
Imagine shouting into a long, endless hallway. The sound travels into the abyss with no discontinuity and eventually just fades into nothingness. Next, imagine doing the same thing, but the hallway is truncated with a wall. This time, when you shout your voice is reflected by the wall and echoes back at you. This phenomenon of reflection is analogous to dealing with high frequency signals (hundreds of MHz or GHz) in the RF world. Any mismatch in impedance along the transmission lines of an RF system will result in signal reflection. This reflection is suboptimal in RF design as it reduces transmission quality and efficiency. One useful parameter when designing at high frequencies is the S-parameter, or “Scattering parameter”. It is used to describe the reflection/transmission characteristics of a port network system. In other words, it helps describe how RF energy propagates through a multi-port network. We will be exploring this parameter in depth and showcasing its implementations when analyzing systems and filters at high frequencies using Moku:Lab’s Frequency Response Analyzer. We will visualize transmission line problems and impedance matching with Smith charts.
Theory
S-parameters are complex numbers, meaning they have both imaginary and real parts, thus can represent both magnitude and phase. Since we care mainly about power gain or loss we will focus on the magnitude as a function of frequency.
S-parameter characterization of a Device Under Test (DUT) treats that DUT as a black box with one or more ports, where signals can both enter and exit any port. This box can contain a multitude of system variables: resistors, filters, integrated circuits, or transmission lines, the details of which are hidden. The beauty of S-parameters is that we can fully understand a DUT by just analyzing the transmitted and reflected signals as described by its S-parameters. Below is a figure representing a 2-port DUT network along with all the signal paths captured by S-parameters.
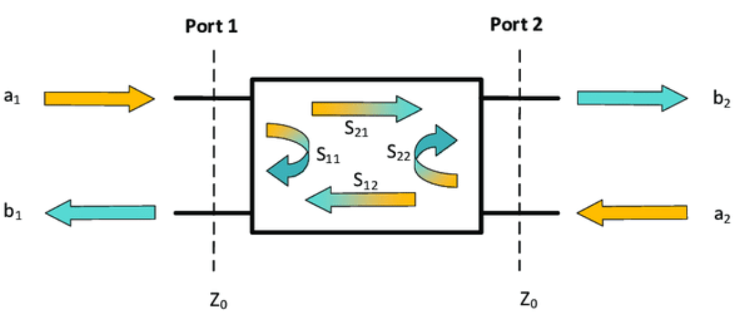
Figure 1: S-parameter representation in a 2-port network
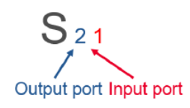
Notice that the four S-parameters for this 2-port network have subscripts relating the ports that are under consideration. The first number is the output port (emerging) and the second number is the input port (applied) as depicted in this figure below.
For example, S22 represents the reflected power (magnitude and phase) of the system from port 2 at a certain frequency. Moku:Lab’s FRA is capable of driving a DUT with a swept sine wave into a system’s input port and extracting the amplitude and phase response at a system’s output port. On its own, Moku:Lab is capable of measuring S12 or S21 of a 2-port system, but not the S11 and S22.
These complex numbers arise from a mathematical representation known as a scattering matrix. In this format the rows and columns represent the number of ports present. The matrix allows for a powerful and scalable linear tool that can be used to isolate and study certain port characteristics in an n-port network.
Directional coupler
A directional coupler is an analog device that is designed to couple a certain amount of power transmitted a certain direction (but not the other direction). The directional coupler we are going to use to measure S-parameters is a Mini-Circuits ZFDC-10-21. It has an input (In), an output (Out), and a coupling (CPL) port. For signals traveling from the input to output, a small portion of the power is coupled to the CPL port. For signals traveling in the reverse direction, almost no power is coupled. This means if we place a DUT at the input port of the RF coupler and drive the device from the output port, we can probe the reflected power by monitoring the CPL port. With the help of the directional coupler, Moku:Lab’s FRA is able to measure all four S-parameters of a 2-port system.
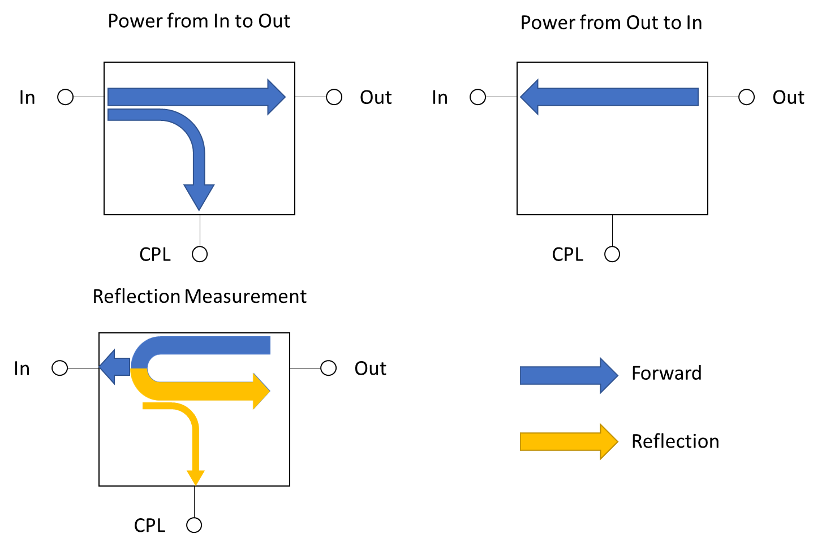
Figure 2: Power flow inside a directional coupler under different circumstances
Moku:Lab Set Up
Our 2-port network will be a bandpass filter by Mini-Circuits (BBP-35A+) with a frequency range of 30-40MHz.
Figure 3 shows the four arrangements of the Moku:Lab with respect to the 2-port filter (BPF) and RF coupler (Mini Circuits ZFDC-10-21). Notice that a 50Ω terminator is connected in series with the filter to preserve impedance match when measuring S11 and S22 parameters.
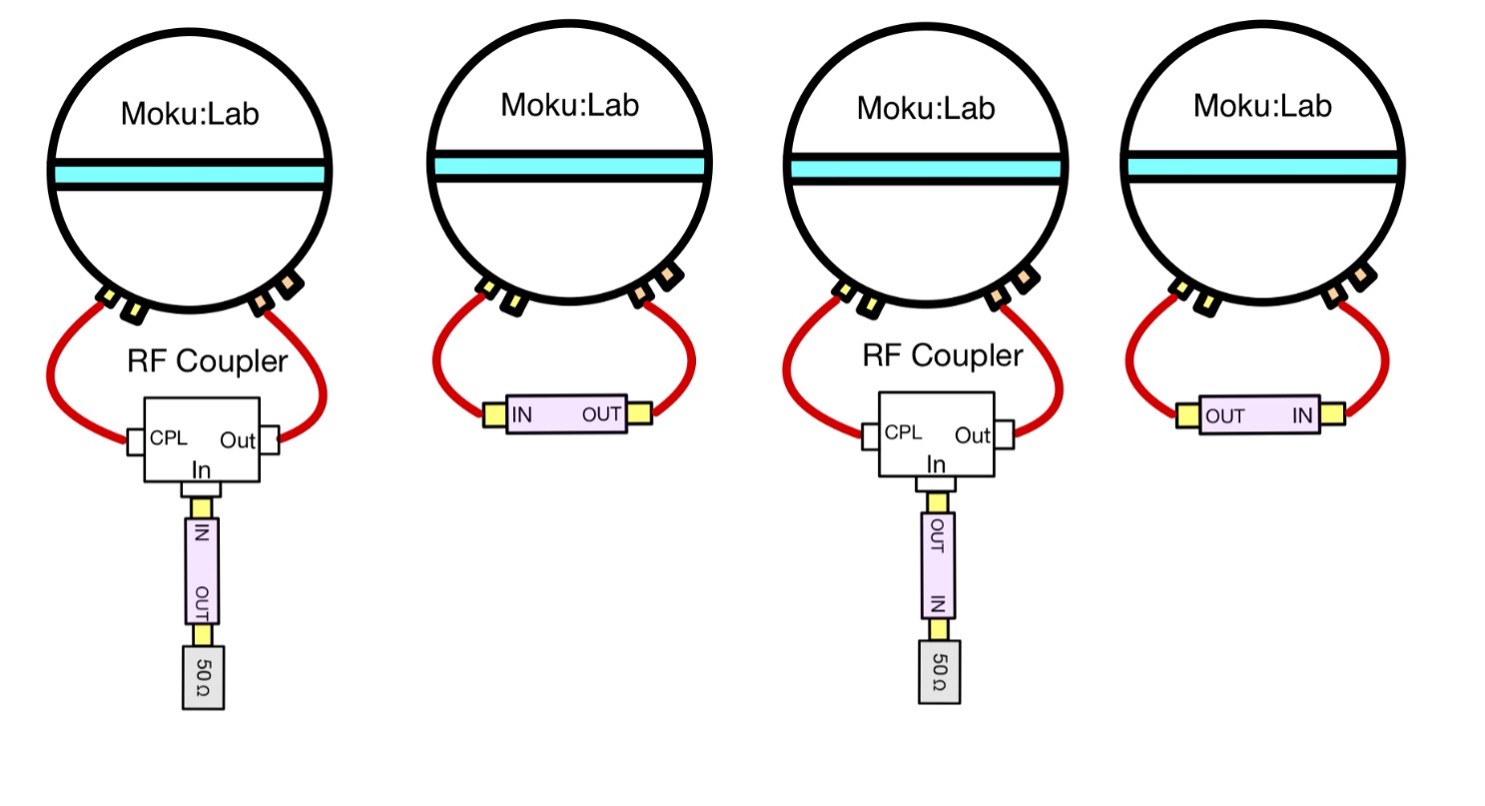
Figure 3: Moku:Lab configurations for S-parameter measurements
Measurement Validation
In this section we will validate the RF components by comparing FRA measurements over a large bandwidth to specifications (e.g., from datasheets).
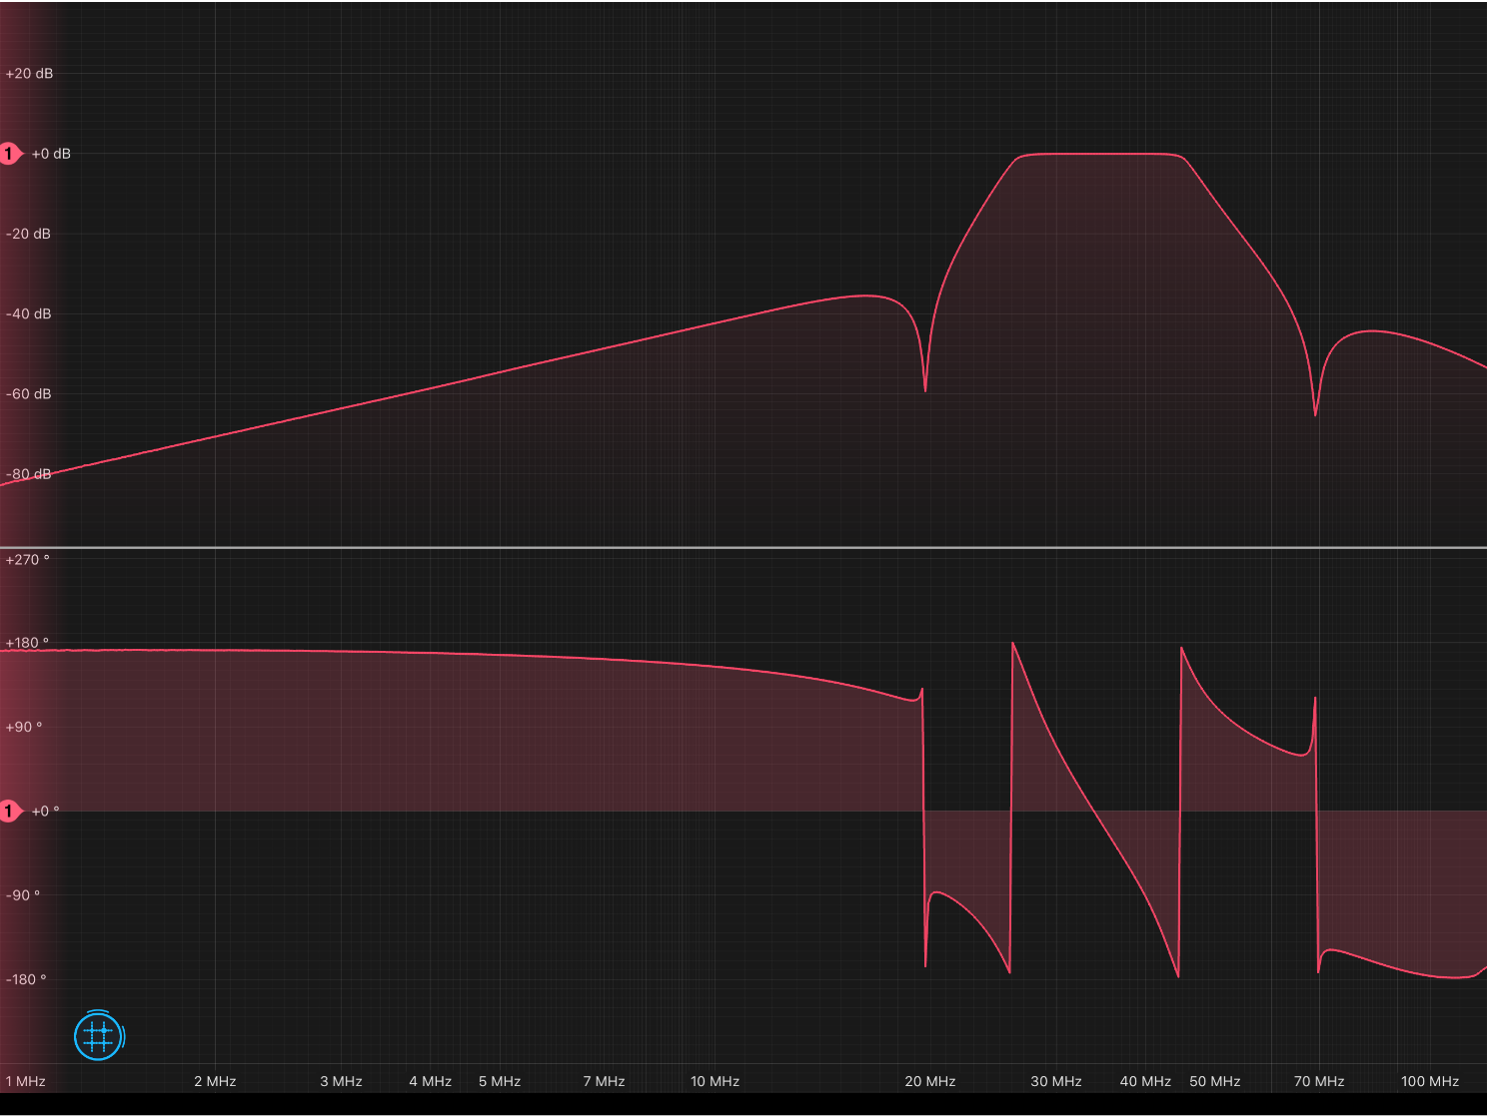
Figure 4: Moku:Lab FRA plots for bandpass filter
The magnitude plot on the top of Figure 4 shows the approximate 30-40MHz bandpass that the filter is rated for while the bottom plot displays the phase. Both measurements are made with a 50Ω input impedance setting, sweeping the frequency range from 1 to 120 MHz. We can now validate these results against known data to assure Moku:Lab’s capability of accurately measuring all four S-parameters.
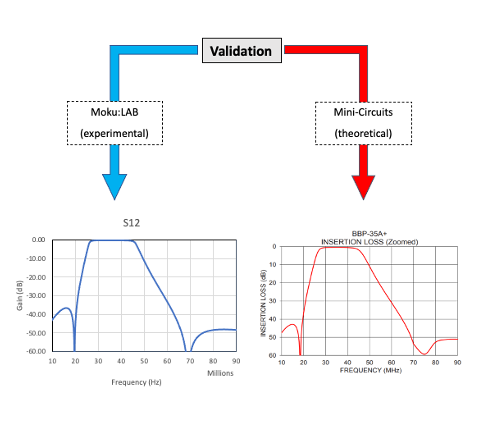
Figure 5: Measured and datasheet S12 plots
In order to validate our measurements we will compare the experimental data measuring the transmission signal (S12) from Moku:Lab’s FRA to the spec sheet provided by Mini-Circuits.
Comparing both the theoretical and experimental plots for S12 it is clear that there is reasonable agreement, validating that Moku:Lab produces accurate S-parameters with FRA.
Now that we have confidence in the results produced by this setup of the mini-circuits coupler with Moku:Lab’s FRA, we can use the procedure above to record all four S-parameters of our two-port system.
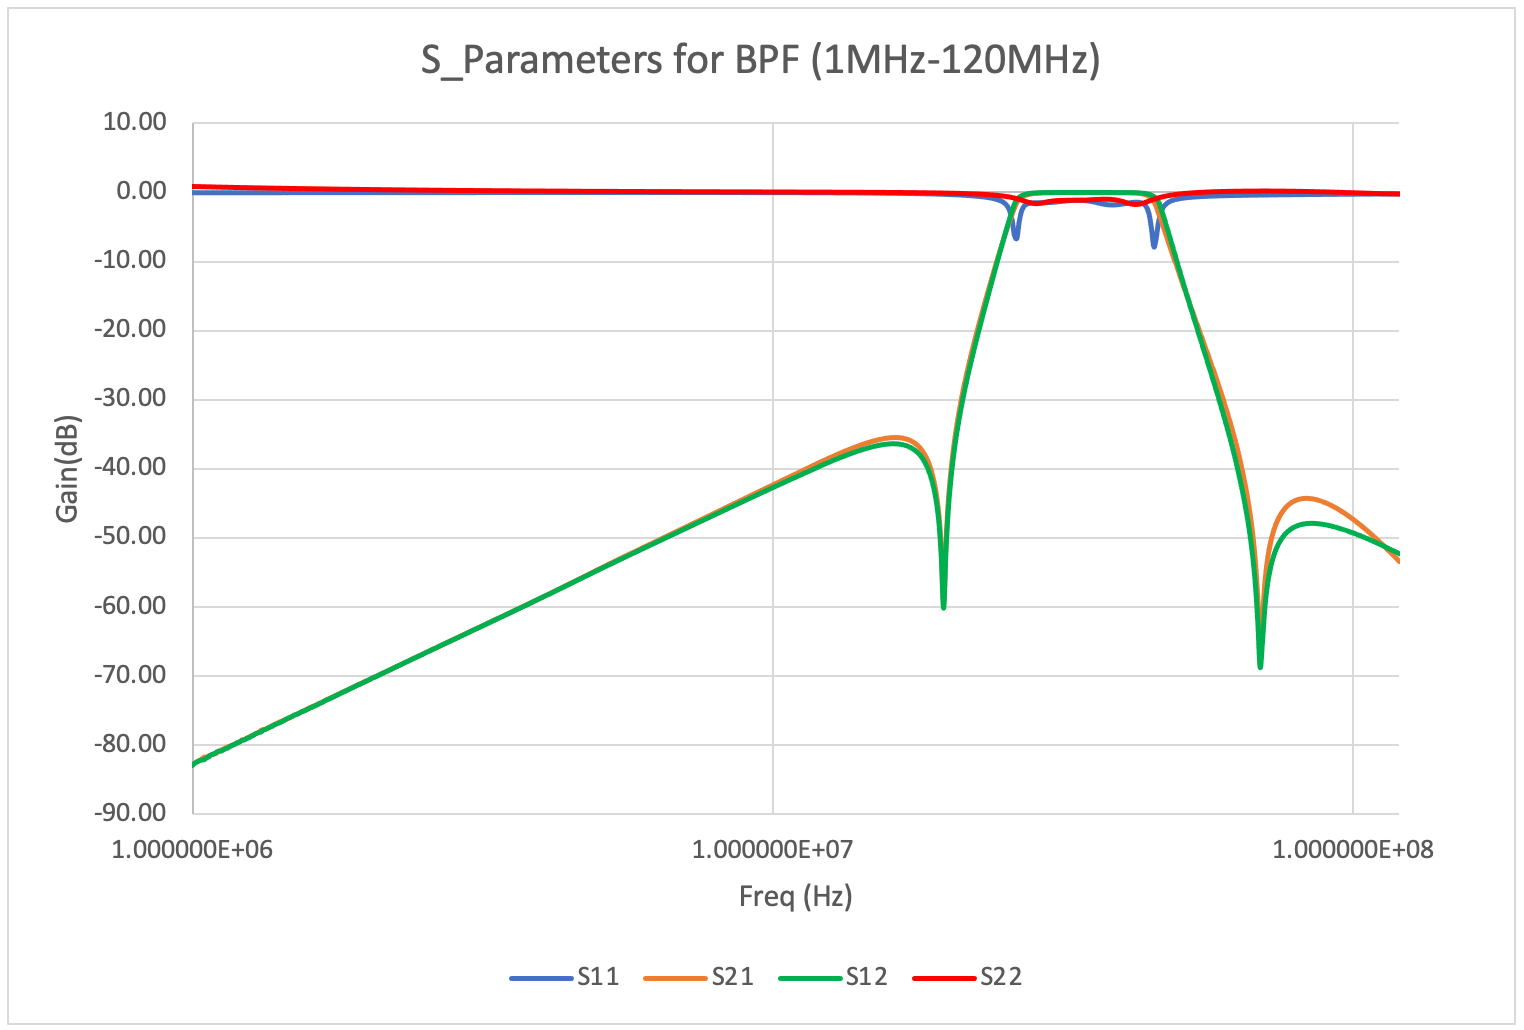
Figure 6: S parameter magnitude plots
Figure 6 depicts reflection signals (S11 and S22) and transmission signals (S21 and S12) in a frequency range from 1 MHz to 120 MHz as plotted from Moku:Lab measurements.
Further Analysis
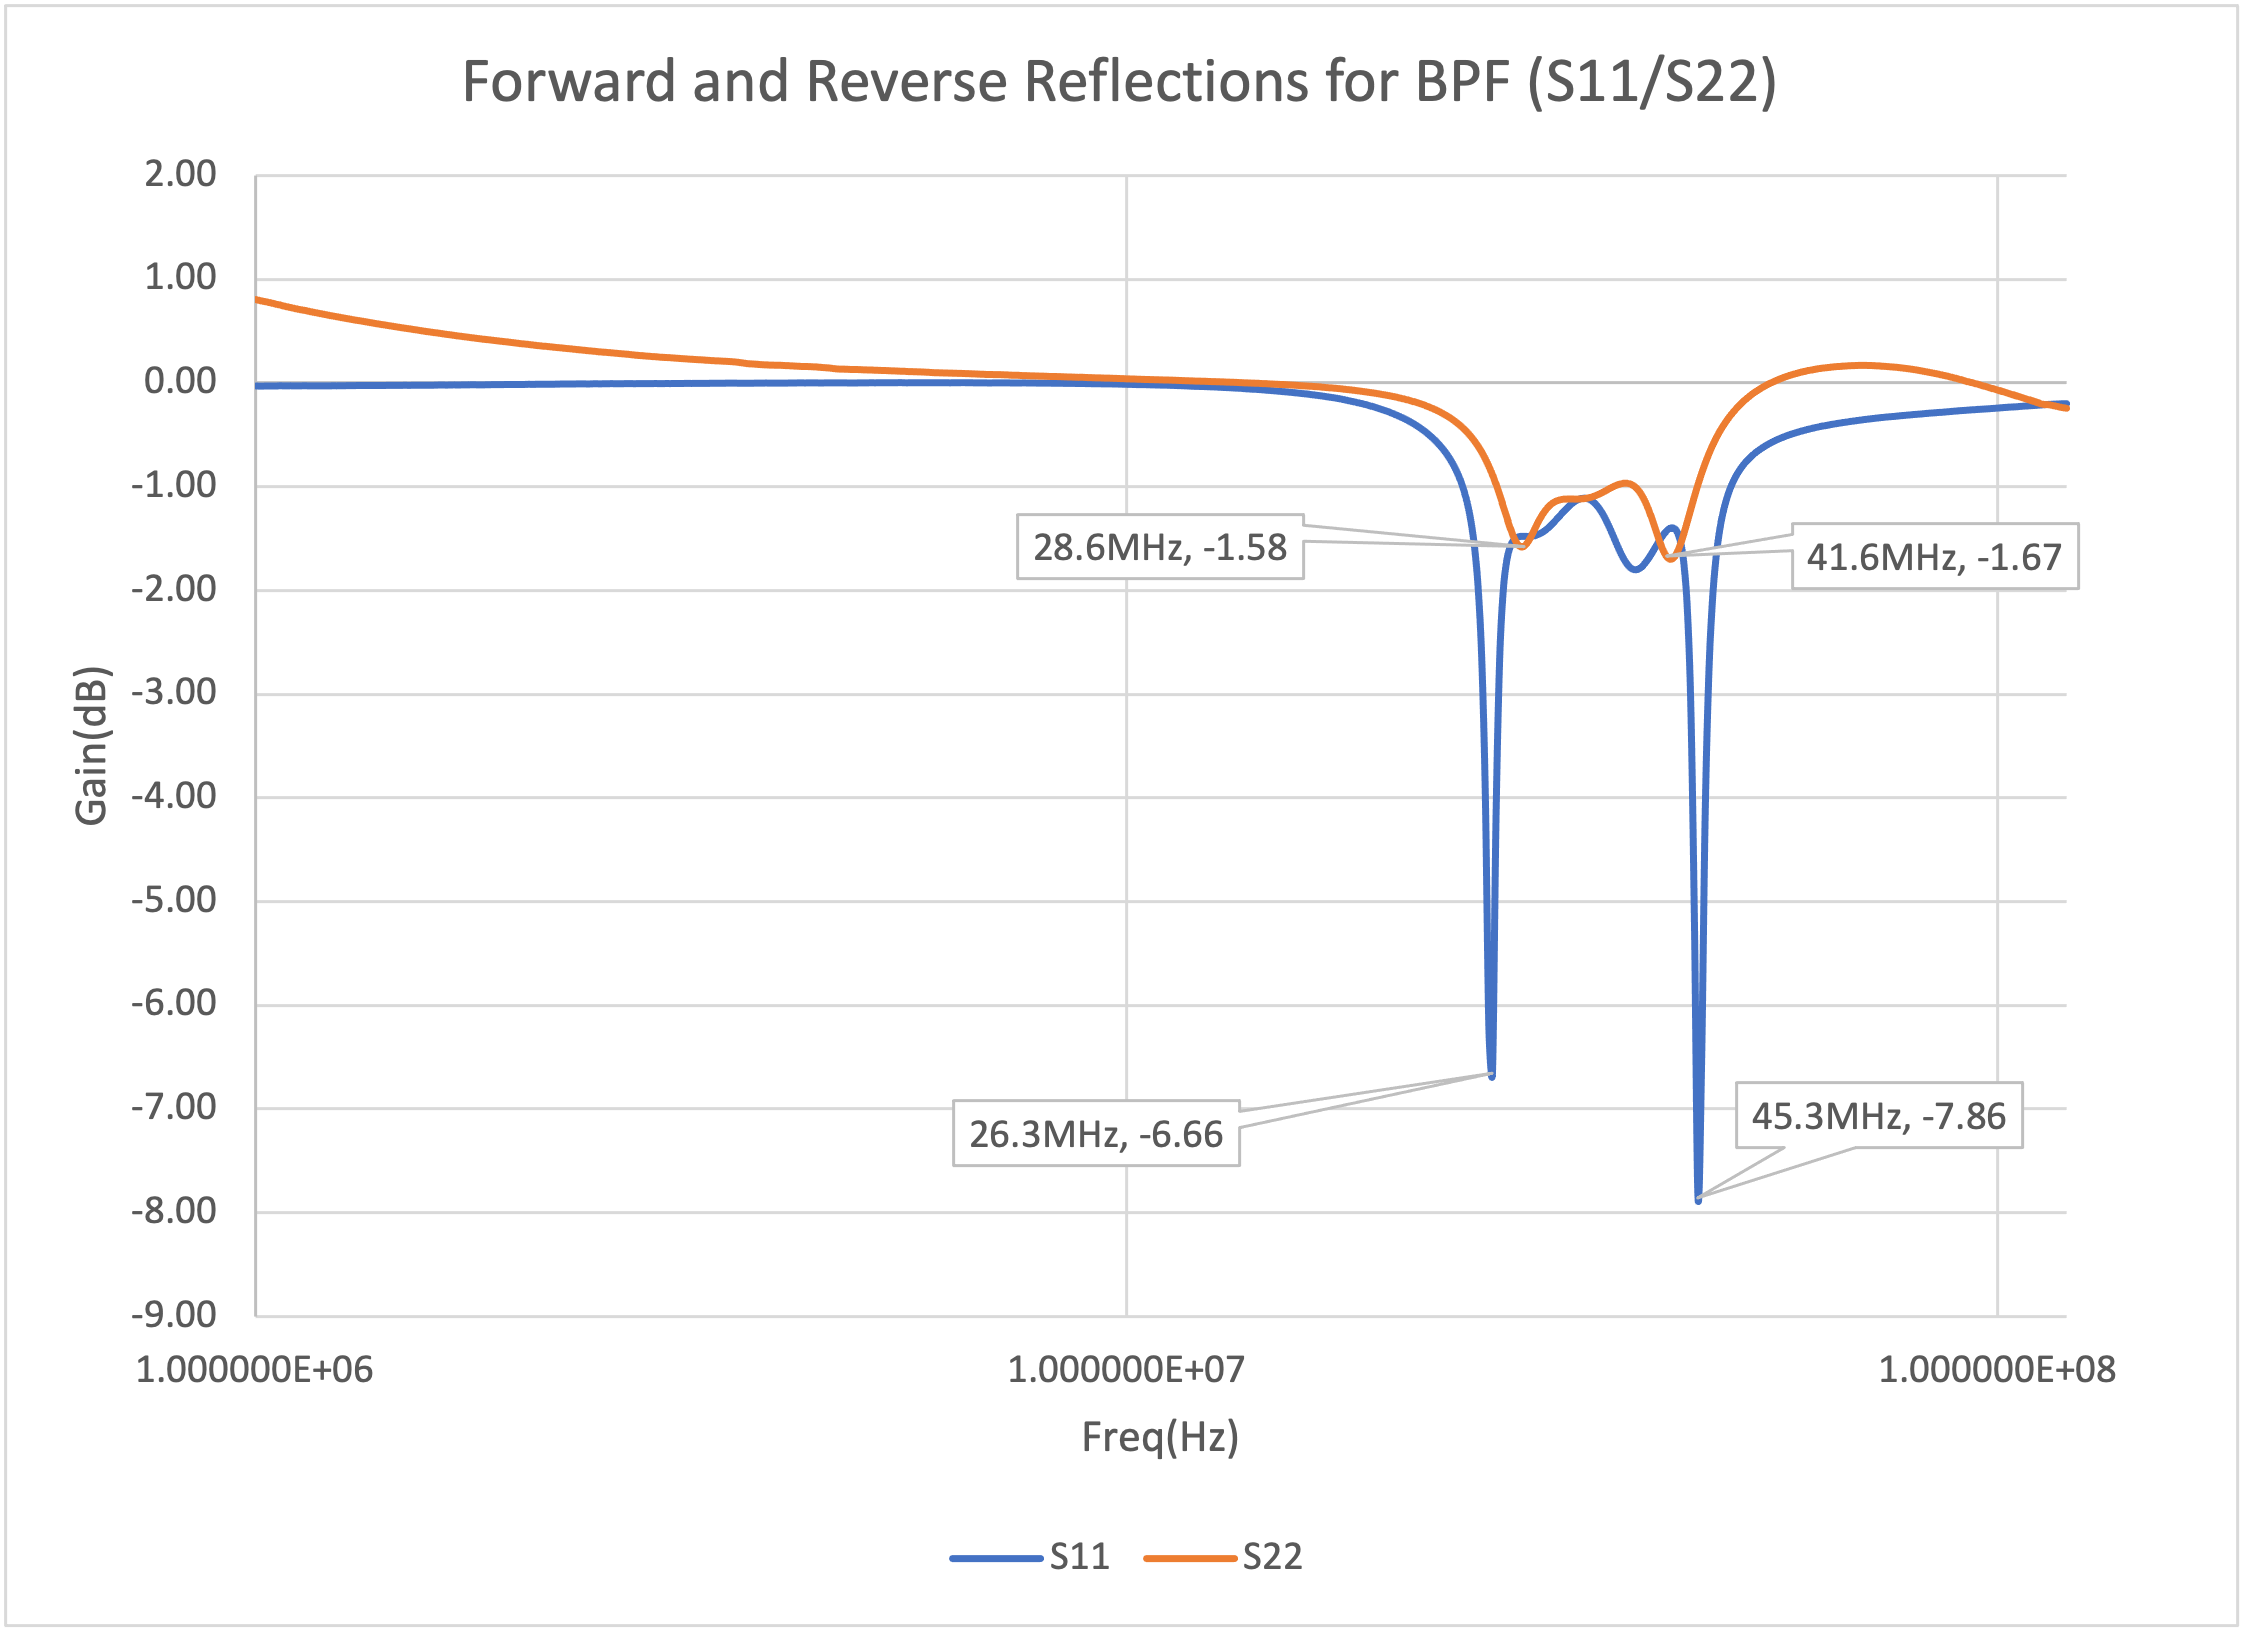
Figure 7: S11 and S22
Isolating the forward and reverse signal reflections we notice significant drop offs around the bounds of the pass band (30-40 MHz). When dealing with sensitive systems, attenuations such as -6.66 dB, -7.86 dB can cause diminishing power transfers as most of the signal is reflected. Avoiding these limits and staying within the bounds of 28.6 MHz and 41.6 MHz will eliminate unwanted forward and reverse reflections, thus maximizing the signal’s transmission throughout the system.
Smith Chart via MATLAB
With the help of the MATLAB RF TOOLBOX we are able to import magnitude and phase data into MATLAB following a .s2p file format. Here we will be comparing the S-parameters provided by Mini-Circuits to our experimental S-parameters captured by Moku:Lab.
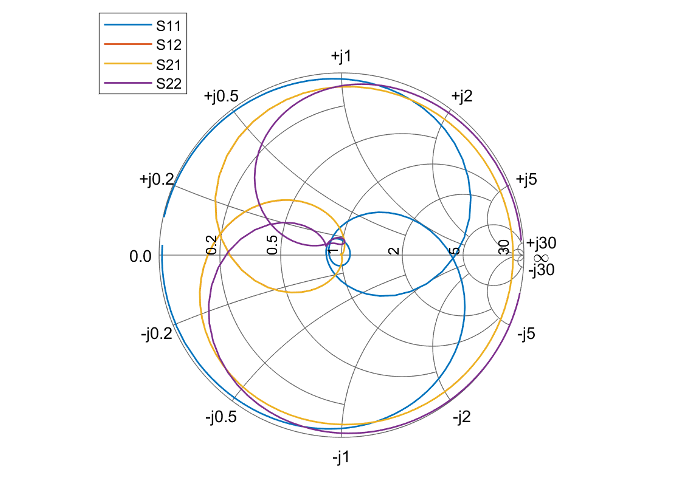
Figure 8: Smith chart derived from datasheet
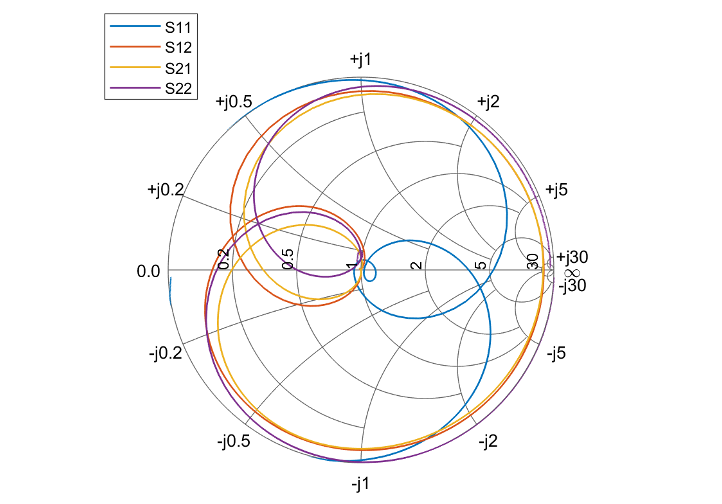
Figure 9: Smith chart derived from Moku:Lab measurements
Smith charts are an invaluable tool for RF engineers as they characterize S-parameters in a graphical and easy to read method, allowing for capacitive or inductive impedance matching.
Conclusion
In this application note we showcased the power of S-parameters when analyzing an RF network. By pairing the Frequency Response Analyzer with a RF coupler, accurate and repeatable S-parameter data of a n-port network can be produced. Furthermore, this reflection data can be exported and visualized via Smith Charts with MATLAB. This allows for deeper analysis on impedance mismatch as it relates to signal reflections within the system.
Reference
[1] https://www.microwaves101.com/encyclopedias/s-parameters
[2] .s2p file format, Macom application note AN3009
Have questions or want a printable version?
Please contact us at support@liquidinstruments.com