





This white paper provides a guide on configuring the Moku Time & Frequency Analyzer for Hanbury Brown and Twiss experiments, enabling real-time photon counting and analysis.
The Moku Time & Frequency Analyzer (TFA) measures intervals between configurable start and stop events with sub-ps precision. While using the TFA, you can compute lossless histograms of interval duration in real time, allowing you to view photon counting experiment progress live rather than computing graphs exclusively in post-processing. By populating real-time histograms, you can observe photon bunching or antibunching behavior, investigate the second order correlation function, and analyze coherence properties of the photon source. One such application of this feature, Hanbury Brown and Twiss experiments, is an ideal use case of real-time histogram generation.
Hanbury Brown and Twiss (HBT) experiment background
In a Hanbury Brown and Twiss (HBT) experiment, scientists place two detectors at different locations to observe two split photon beams from a distant source. One beam travels a different path length relative to the other, resulting in a temporal offset between the arrival of photons at the two detectors. The experimenters measure the intensity of light arriving at each detector as a function of time. They then analyze the correlations between the intensities recorded by the two detectors.
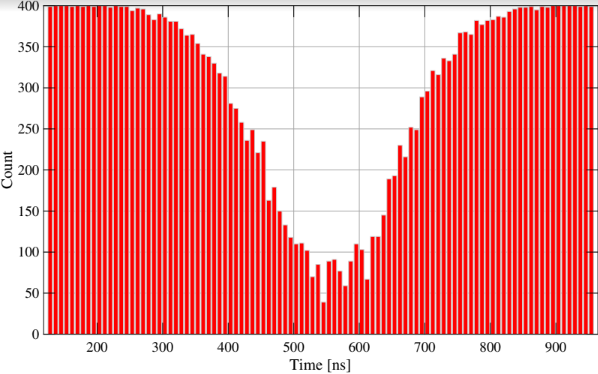
The HBT interferometer helps to verify the quantum nature of light with applications in astronomy, quantum information processing, and quantum communication.[1] If the light behaves classically, the intensities detected by the two detectors should be uncorrelated. However, in quantum mechanics, photons can exhibit either bunching or anti-bunching behavior. Bunching refers to the tendency of photons to arrive together, while anti-bunching refers to the tendency for photons to avoid arriving together. If the detected photons exhibit bunching, it suggests that they are correlated, meaning they are more likely to arrive at the detectors simultaneously. Conversely, if they exhibit anti-bunching as seen in the histogram in Figure 1, it implies that they are anti-correlated, meaning they are less likely to arrive simultaneously. By observing photon arrival times using histograms, researchers can determine important spatial and temporal correlations between photons detected by different detectors.
By using the Moku Time & Frequency Analyzer to perform photon counting for HBT experiments, researchers can utilize FPGA-based, reconfigurable hardware. This form factor lends to zero dead-time measurements, an intuitive user interface with real-time, lossless histograms, and embedded data logging to perform further analysis after you have gathered the necessary data.
Using the Moku Time & Frequency Analyzer for Hanbury Brown and Twiss experiments
Materials and hardware configuration
- Photon emitter
- 50:50 beam splitter
- Photodetectors
- Moku device
Hanbury Brown and Twiss Configuration
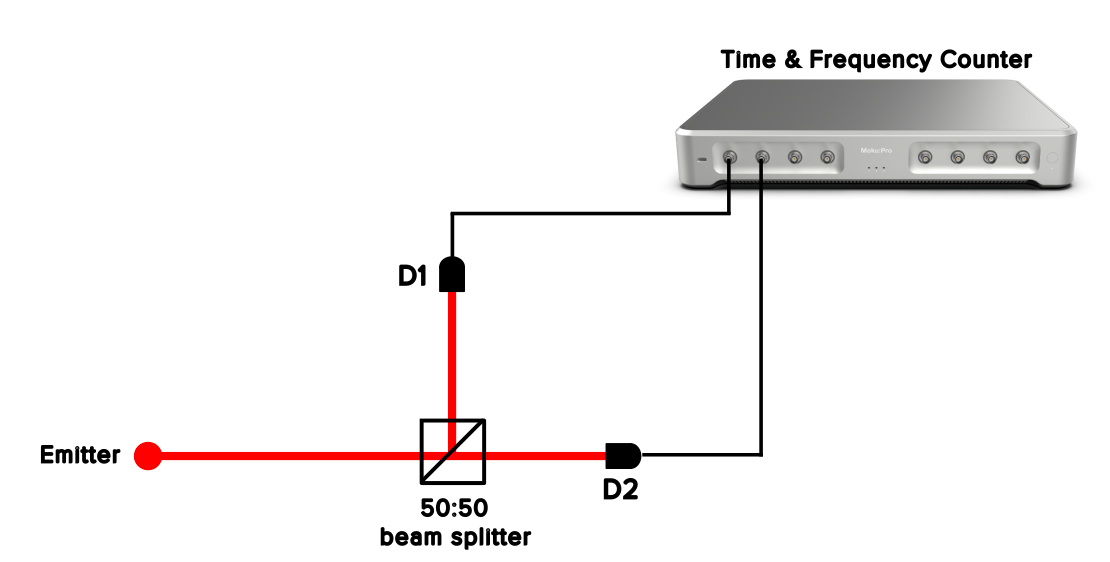
The emitter sends photons toward the beam splitter, as seen in Figure 2. From there, the beam diverts on two paths: one path is directed toward photodetector 1 (D1), and the other is directed down a longer path toward photodetector 2 (D2). Connect the path from D1 to Input 1 of the Moku device. Connect the path from D2 to Input 2 of the Moku device.
Time & Frequency Analyzer instrument setup for photon counting
- In the Moku app, open the Time & Frequency Analyzer.
- In the Events tab, set the acquisition mode to Continuous.
- Configure Event A to start our interval, as seen in Figure 3. This corresponds to path 1.
- Set the source to Input 1.
- Configure the threshold to correspond with the pulse of the photodetector. For photodetectors such as an avalanche photodetector, the output voltage is a function of the incident light power Popt, the sensitivity of the detector RM(λ) at a given wavelength and M factor, and transimpedance gain G. [2]
- Set the Edge to Rising in order to detect the pulse.
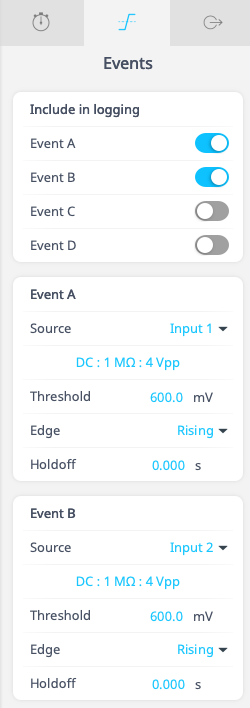 Figure 3: Event A and Event B configuration
- Configure Event B to end our interval. This corresponds to path 2.
- Set the source to Input 2.
- Configure the threshold to correspond with the pulse of the photodetector.
- Set the Edge to Rising in order to detect the pulse.
- If desired, set the holdoff time. This feature prevents the detector from registering consecutive pulses within a short time window, helping to distinguish between individual photon events.
- Configure the interval as seen in Figure 4. With the time between photon arrivals, we can begin to determine possible correlations between the photons.
- In the Intervals tab, set Interval A to start with Event A and end with Event B.
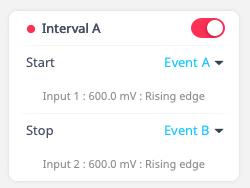 Figure 4: Interval setup from Event A, the start event, to Event B, the stop event
- In the Intervals tab, set Interval A to start with Event A and end with Event B.
- Set up data logging to log raw event timestamps
- Log data using the embedded Data Logger by pressing the Data Logger icon. Configure your logging parameters (start, duration, filename, etc) and start logging to internal storage. Download logged data using the File Manager and convert to a CSV, HDFS, MATLAB, or NumPy file for easy export and processing.
- Configure lossless, real-time histograms
- On the histogram view, click the settings icon to configure histogram settings seen in Figure 5. The on-device histograms are calculated in real time, meaning experiment results generate in parallel with your measurements.
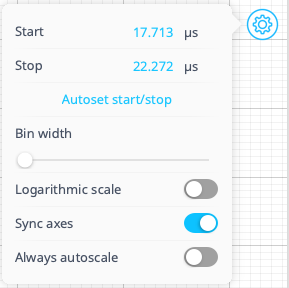 Figure 5: On-device histogram settings
 - To autoscale the histogram view, select “Autoset start/stop”. You can also choose to turn “Always autoscale” on.
- On the histogram view, click the settings icon to configure histogram settings seen in Figure 5. The on-device histograms are calculated in real time, meaning experiment results generate in parallel with your measurements.
Conclusion
When performing photon counting experiments, photon detectors are often difficult to configure or require complex data manipulation for meaningful results. The Moku Time & Frequency Analyzer provides an easy-to-use, intuitive solution for Hanbury Brown and Twiss experiments and other photon counting applications. In addition to photon counting, users can employ the Time & Frequency Analyzer as a frequency counter, event detector, or time-to-voltage converter by using the steps shown in this document and adjusting the configurable event detectors to suit the specific application. To learn more about the Time & Frequency Analyzer, speak with an engineer.
Footnotes
[1] Ung, Thi. (2018). Désordre contrôlé sur des nanostructures métalliques pour des applications en plasmonique. [2] “APD130x Operation Manual,” Feb. 13, 2020. https://www.thorlabs.com/drawings/10fea885cf23bdb0-AD49B71D-017A-23A7-256FDFF4F821C7B9/APD130A2-Manual.pdf (accessed Apr. 04, 2024).