


This application note presents an example of making impedance measurements using the Moku:Go device. Here in Part 1, we will explore the underlying mathematical principles of measuring resistance and its accuracy using the software-defined Moku Frequency Response Analyzer. In Part 2, we expand our analysis to include inductance. In Part 3, we will explore capacitance.
Using the Moku Frequency Response Analyzer
The Moku Frequency Response Analyzer drives a swept sine wave on the Moku:Go device’s outputs and simultaneously measures the received signal amplitude (or power) on the device’s input. This can be used to measure the transfer function of a system or device under test (DUT) and thus create a plot of amplitude and phase vs. frequency, commonly referred to as a Bode plot.
Frequency Response Analyzer: Voltage units
To measure the impedance of a device under test (Zdut), we need to understand a Bode plot, which is plotted in the Frequency Response Analyzer. The Frequency Response Analyzer amplitude plot uses units of dBm, dBVpp, or dBVrms. The dBVpp unit mode, or decibels relative to one-volt peak-to-peak (1 Vpp), is a convenient unit of measurement in this situation. Defined as:

So 1 Vpp expressed in dBVpp gives:

Figure 1 shows use of the Frequency Response Analyzer to generate a 1 Vpp sine wave and with Output 1 connected via direct coax to Input 1. The resulting amplitude is of course flat across the frequency range (0-8 kHz) with an amplitude of-0.0094 dBVpp, very close to the calculated 0 dBVpp. The discrepancy equates to 0.001 Vpp (or 0.1%).

Figure 1: Frequency Response Analyzer plot of 1 Vpp driven directly into the Moku:Go input
Impedance
Single-port measurement
With this knowledge of the Frequency Response Analyzer power units, we can now make an impedance measurement.
In this first example, we will measure Rdut of a simple 10 kΩ, 10% tolerance resistor. Because the input impedance of Moku:Go is 1 MΩ, we need to lower this value. We can do this by connecting a resistance in parallel with the input to ensure that the power dissipation occurs over the DUT. In this example, a 50 Ω terminator resistor was connected to input one. The output load on Moku:Go is 200 Ω, so the effective circuit is shown in Figure 2:

Figure 2: Effective circuit for Moku:Go
Figure 3 shows the correlating setup using a Moku:Go device and 50 Ω T-piece on the input. Please note that it is important to avoid using the Oscilloscope probes to connect to the DUT, as the probes have an impedance that may alter the accuracy of your measurements.

Figure 3: Single-port setup
The Moku:Go Frequency Response Analyzer operates up to 20 MHz, but for these resistance measurements, a plot to 10 kHz is sufficient. Figure 4 shows the Moku Frequency Response Analyzer amplitude response equal to -46.18 dBVpp at Vin.

Figure 4: Frequency Response Analyzer plot of a 10 kΩ DUT (single-port)
Rearranging power equation (1) we can state:

With measured Pdb of -46.18 dBVpp, we calculate Vin = 4.91 mV.
The resistor divider of Rdut and the Moku inputs and output in Figure 2 gives us:

Where Rin is the equivalent parallel resistance:

Solving gives Rdut = 9933 Ω.
A digital voltmeter (DVM) reading of this resistor showed 9970 Ω.
So from this simple, one-resistor measurement, we can conclude Moku:Go is accurate within 37 Ω (<1%).
Low-impedance measurement
The previous example used a standard 10% tolerance resistor. We are now interested in measuring a lower impedance to a high level of accuracy. To do this, we will use a 100 Ω, 0.005% tolerance high-precision resistor. Using the previous method, we obtain a power magnitude plot (Figure 5).

Figure 5: Frequency Response Analyzer plot of 100 Ω, 0.005% (single-port)
Applying the measured power of -16.89 dBVpp to equations (2) & (5) we calculate Rdut to be 99.33 Ω. This agrees with the known value, but we can do better with a two-port measurement.
Two-port measurement
To further improve our result, we need to account for the loading of the DUT on the Moku output.
We can accomplish this with a two-port measurement utilizing the second input port of the Moku device to observe the applied signal level. The configuration of this setup is shown in Figure 6.

Figure 6: Two-port configuration
Please note that a parallel resistance is still required for input 1. Here, we will continue using the 50 Ω terminator resistor. To ensure minimal loading of the output, Input 2 remains at a high impedance of 1 MΩ.
Figure 7 shows that R1 is the same as the equivalent resistance calculated as the input resistance in the single-port example.
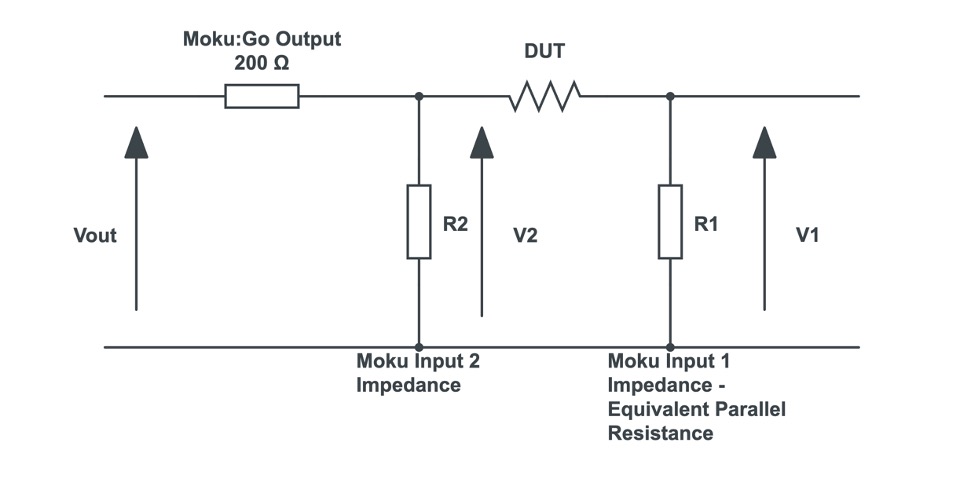
Figure 7: Two-port equivalent circuit
We can derive Rdut in figure 7, from Ohm’s law:


Substitute (7) into (6):

We set up this two-port measurement with our tight tolerance 100 Ω, 0.005% resistor and captured the Moku Frequency Response Analyzer plot in Figure 8.

Figure 8: 100 Ω (two-port)
Note, we have used the Frequency Response Analyzer’s math channel to produce V2/V1 in orange. This is very quick and simple to configure using the Frequency Response Analyzer interface.
From (8), we see that the Rdut can be calculated simply from the V2:V1 voltage ratio.
The math channel has calculated the power ratio as 9.526 dBVpp. Thus, the voltage ratio is:

So, with R1 equal to 50 Ω, we can apply (8) to obtain Rdut = 99.72 Ω.
We can now apply this two-port method to the original 10 kΩ / 20% resistor; Figure 9 shows the Frequency Response Analyzer response.

Figure 9: 10 kΩ (two-port)
Using our established formula, the power ratio of 46.04 dBVpp gives Rdut = 9976 Ω two-port method leads to a useful improvement from the measured 9333 Ω with the single-port method. This proves that the two-port method allows for a higher degree of accuracy.
Summary
The Moku:Go Frequency Response Analyzer can be used to make impedance measurements and determine, to a <1% accuracy, the value of a resistance.

The two-port method allows for the loading of the DUT.
Using Python
You can also automate your testing and impedance measurements with the Moku through APIs. In this example, a Python script was created to conduct single-port and two-port measurements that you can apply to any Moku device with the alteration of a few parameters, which are noted throughout the script.
Find the code for the single-port and two-port measurements here.
Questions or comments?
Contact us at support@liquidinstruments.com.