This application note presents an example and discussion of how to make accurate impedance measurements with a Moku:Go device. In Part 1, we explored the math of measuring resistance using voltage measurements from the software-defined Moku Frequency Response Analyzer. Now in Part 2, we’ll explore inductance measurements.
Using the Moku Frequency Response Analyzer
The Moku Frequency Response Analyzer drives a swept sine wave on the Moku outputs and simultaneously measures the received signal amplitude (or power) and phase on the Moku inputs. This data can be used to measure the transfer function of a system or device under test (DUT) and subsequently create a plot of amplitude and phase vs. frequency, commonly referred to as a Bode plot.
Frequency Response Analyzer: Voltage units
In the first part of this application note series [1], we discussed the dBVpp voltage measurement of a 1 Vpp sine wave driven out from the Moku output and looped back into an input.
We determined that, when driven across the 1 MΩ input of the Moku device, this can be used to capture a power measurement:
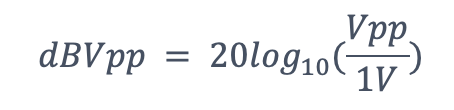
Thus, 1 Vpp expressed in dBVpp gives:

We then used this voltage ratio to accurately measure resistive impedance.
Inductance
Two-port measurement
For this example, we will measure a known inductor: a Wurth electronics part #7447021. This is a 100 μH inductor, specified at 10 kHz with a 20% tolerance, as seen in Table 1.
![Table 1: Inductor specification from data sheet [2]](https://liquidinstruments.com/wp-content/uploads/2023/10/Screenshot-2023-10-25-at-9.21.23-AM.png)
Table 1: Inductor specification from data sheet [2]
An example setup using Moku:Go is shown in Figure 1. For a two-port measurement, we use the first and second inputs. This allows for the inductive loading on the Moku:Go swept sine output. Like in the resistive example, we use a termination resistor on Moku Input 1 in order to ensure the power dissipation occurs across the DUT. To ensure minimal loading on the output, we will leave Moku Input 2 at its internal 1 MΩ input resistance.
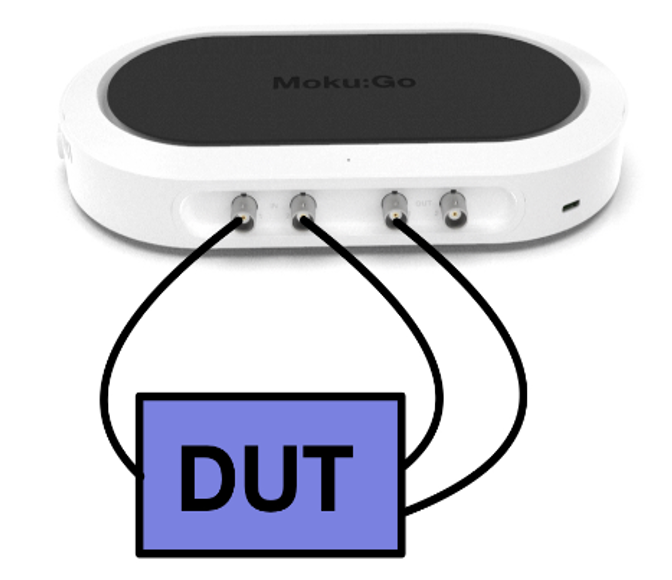
Figure 1: Moku:Go measurement setup
The equivalent circuit, showing the Moku:Go input impedances, is shown in Figure 2.
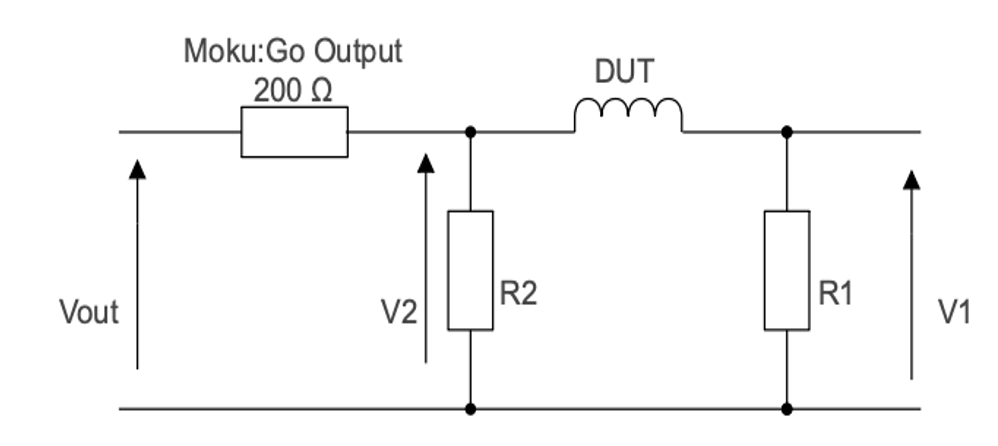
Figure 2: Two-port equivalent circuit
R1 and R2 are the input impedances (50 || 1 MΩ and 1 MΩ, respectively); the DUT is the inductor.
The Moku Frequency Response Analyzer will allow us to determine the phase of V1 vs. V2 across frequency, as well as the magnitudes.
Calculation
Basic circuit theory tells us the inductor presents an inductive reactance and that this reactance and the Moku:Go 1 MΩ input resistance in parallel with the termination resistor’s 50 Ω resistive impedance can be represented as a phasor diagram (Figure 3).
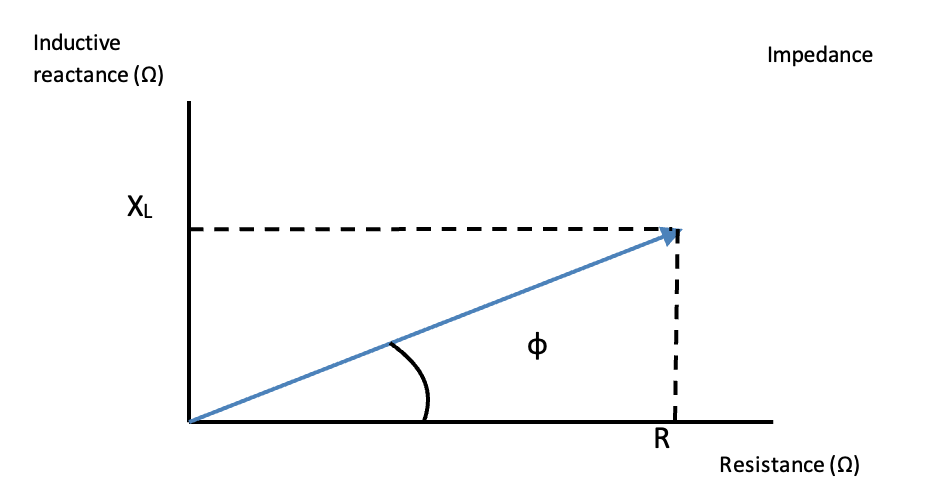
Figure 3: Phasor chart of impedance
Where:

The resistance of the 1 MΩ Moku:Go input in parallel with the 50 Ω terminator resistor is R = 49.9975 Ω. Also, for an inductor:

Thus,

So, we can determine the inductance L if we measure the phase Ø at frequency ƒ.
Measurement setup and result
Figure 4 shows the Moku:Go bench setup. It takes just moments to set up the Frequency Response Analyzer instrument on the Moku: iPad or desktop app and to produce the plots of magnitude and phase vs. frequency.
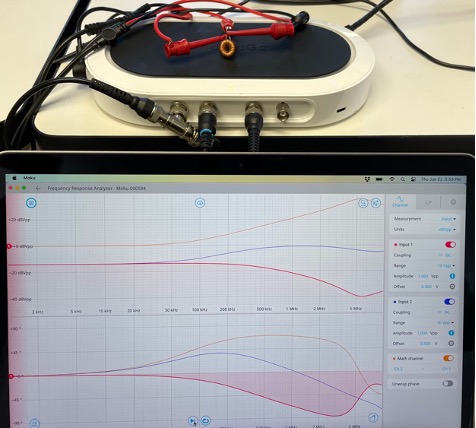
Figure 4: Moku:Go bench setup with desktop app
You can share the plots on the Moku: app by tapping the cloud button, and export screenshots and high-resolution .CSV formatted data to onboard memory, Dropbox, or email. In this case, we shared the data to a Dropbox folder. The exported screenshot is shown in Figure 5.
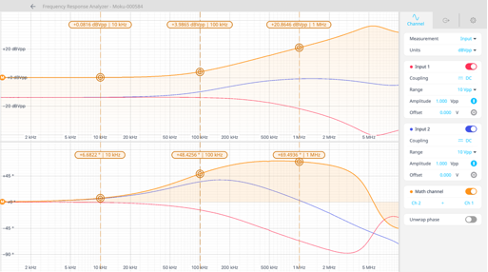
Figure 5: Moku Frequency Response Analyzer sweep of a 100 μH inductor
The swept sine is generated from 1 kHz to 10 MHz on the Moku output Channel 1. The blue trace shows Channel 2 (V2), while the red trace is Channel 1 (V1). The Moku math channel is shown in orange and is configured to show (ch2 ÷ ch1). Several cursors have been added to measure the phase and magnitude at 10 kHz, 100 kHz, and 1 MHz.
The orange math channel cursors allow us to quickly see the phase difference, which comes from dividing Signal 1 by Signal 2, at our 10 kHz frequency of interest, to be Ø = 6.6822°.
From Eq(1), we calculate XL = 5.86 Ω.
From Eq(2), calculate the inductor value L = 93.2 μH.
This is well within the specification of 100 μH ± 20%.
While the inductor is specified at 10 kHz, we can also take our measurements from figure 5 at 100 kHz, where Ø = 48.425°. Again, applying Eq (2), this gives L = 89.7 μH. As expected, the inductance outside of the specified frequency range is not as close to the designated 100 µH value, but still falls within our specified value range.
Since we used the Moku: desktop app to save the high-resolution Frequency Response Analyzer magnitude and phase data to a .CSV file via Dropbox, we can rapidly import this into Excel and, using Eq (2), produce a plot of inductance (blue) and phase (orange) vs. frequency, as seen in Figure 6.
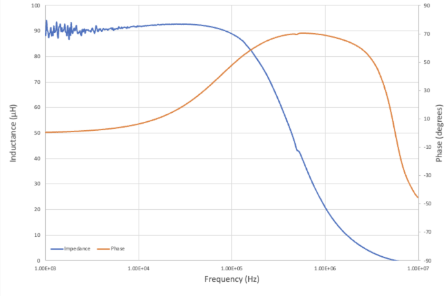
Figure 6: Inductance and phase vs. frequency
This clearly shows that above 100 kHz, the inductance falls off steadily until at around 5 MHz, where the inductance is effectively zero.
This occurs because a real-world practical coil inductor is not a perfect inductor. Rather, it has some resistance and capacitance. The equivalent circuit is shown in Figure 7.
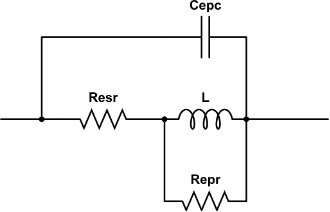
Figure 7: Inductor equivalent circuit
A perfect inductor has impedance that linearly rises with frequency. But a real-world inductor has an effective parasitic capacitance in parallel (Cepc) together with resistive elements Resr and Repr. Resr is sometimes quoted in datasheets as DC resistance and is the resistance of the wire coil. Repr is effective parallel or AC resistance. Cepc is parallel capacitance due to the proximity of the wire coils.
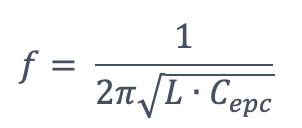
Thus, there is a resonance frequency determined by:
Again, referring to the inductor datasheet [2], we see that the inductor has a typical impedance characteristic showing resonance peak at around 5 MHz, reproduced in Figure 8.
![Figure 8: Wurth inductor typical impedance [2]](https://liquidinstruments.com/wp-content/uploads/2023/10/Typical-impedance-characteristics.png)
Figure 8: Wurth inductor typical impedance [2]
Because Moku devices make it easy to share the Frequency Response Analyzer data to a .CSV via Dropbox, we can readily use Excel to provide a plot of magnitude impedance vs. frequency from the magnitude of the math channel shown in Figure 5. From this data in Excel, we generate the plot, as shown in Figure 9.
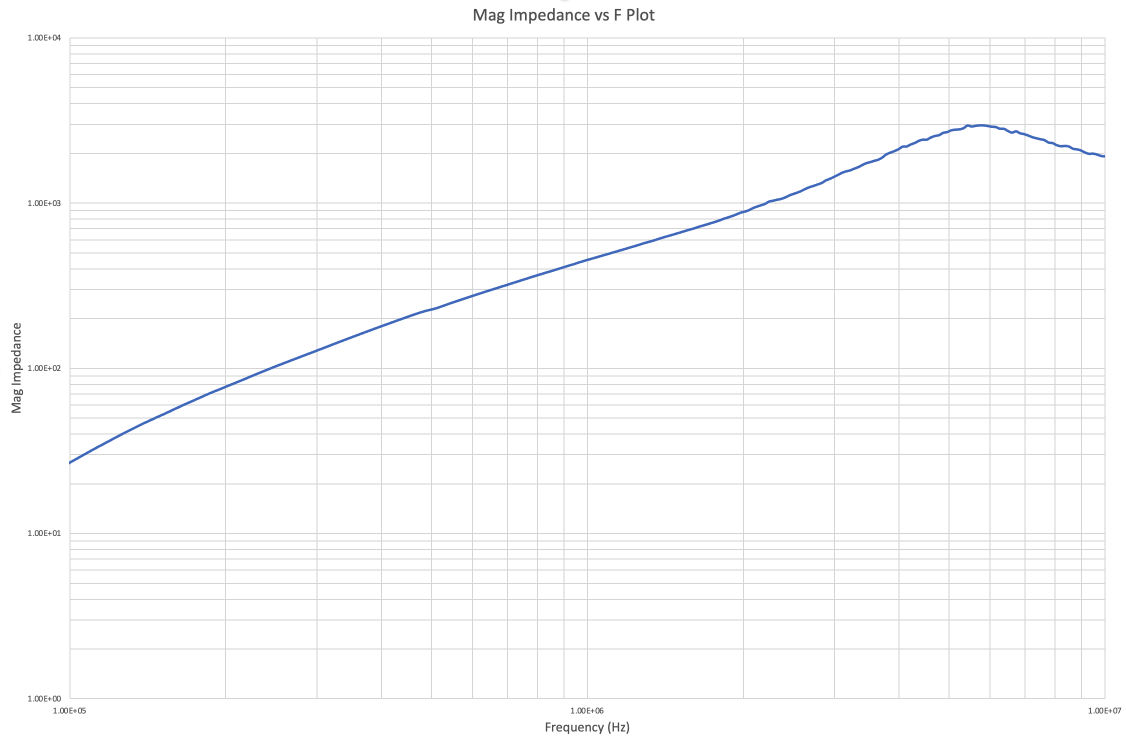
Figure 9: Moku:Go measured impedance
The resonance, as measured, is slightly above 5 MHz and the characteristics of the measurement are closely in line with the typical performance of Figure 8, taken from the manufacturer’s datasheet.
Summary
The software-defined Moku Frequency Response Analyzer can accurately measure the inductive impedance of a component over frequency. The Frequency Response Analyzer is available on FPGA-based Moku:Go, Moku:Lab, and Moku:Pro devices alongside a full suite of other software-defined instruments.
The results were shared via a .CSV file and Dropbox with the desktop Moku: app. We used Excel to plot both inductance and phase vs. frequency together with impedance vs frequency.
The calculated impedance at specified 10 kHz matches the component specification. Additionally, the plotted impedance vs. frequency closely matched the manufacturer’s typical chart up to 10 MHz.
Questions or comments?
Contact us at support@liquidinstruments.com.
References
[1] Impedance measurements with Moku:Go – Part 1: Resistance: https://liquidinstruments.com/blog/2023/06/30/simplifying-impedance-measurements-with-mokugo-part-1-resistance/
[2] Wurth Electronics 100 uH coil inductor data sheet: https://www.we-online.de/katalog/datasheet/7447021.pdf
[3] Moku:Go Frequency Response Analyzer user manual: https://download.liquidinstruments.com/documentation/datasheet/instrument/mokugo/Datasheet-MokuGo-FrequencyResponseAnalyzer.pdf